

Corak sebenar

Bearish pennant
was formed on 03.04 at 14:46:03 (UTC+0)
signal strength 1 of 5
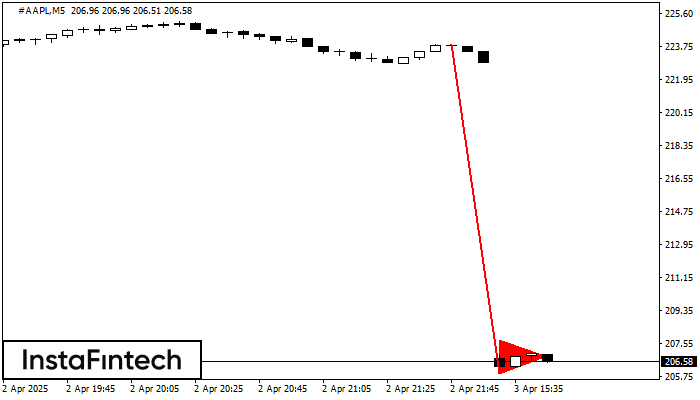
The Bearish pennant pattern has formed on the #AAPL M5 chart. It signals potential continuation of the existing trend. Specifications: the pattern’s bottom has the coordinate of 205.88; the projection of the flagpole height is equal to 1802 pips. In case the price breaks out the pattern’s bottom of 205.88, the downtrend is expected to continue for further level 205.74.
The M5 and M15 time frames may have more false entry points.
- All
- All
- Bearish Rectangle
- Bearish Symmetrical Triangle
- Bearish Symmetrical Triangle
- Bullish Rectangle
- Double Top
- Double Top
- Triple Bottom
- Triple Bottom
- Triple Top
- Triple Top
- All
- All
- Buy
- Sale
- All
- 1
- 2
- 3
- 4
- 5
Double Bottom
was formed on 24.04 at 10:45:49 (UTC+0)
signal strength 2 of 5
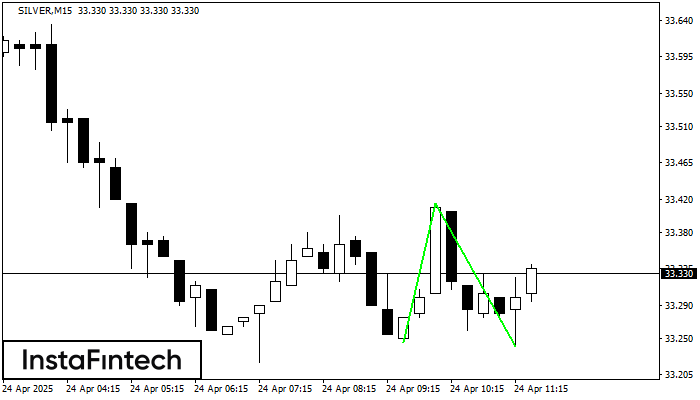
Corak Double Bottom telah dibentuk pada SILVER M15. Ciri-ciri: tahap sokongan 33.24; tahap rintangan 33.41; lebar corak 170 mata. Sekiranya tahap rintangan ditembusi, perubahan aliran boleh diramalkan dengan titik sasaran
Carta masa M5 dan M15 mungkin mempunyai lebih banyak titik kemasukan palsu.
Open chart in a new window
Segi Tiga Simetri Menurun
was formed on 24.04 at 10:20:21 (UTC+0)
signal strength 1 of 5

Berdasarkan carta M5, GOLD membentuk corak Segi Tiga Simetri Menurun. Penerangan: Sempadan yang lebih rendah ialah 3314.14/3331.45 dan sempadan atas adalah 3343.45/3331.45. Lebar corak diukur pada carta pada -2931 pips
Carta masa M5 dan M15 mungkin mempunyai lebih banyak titik kemasukan palsu.
Open chart in a new window
Triple Bottom
was formed on 24.04 at 10:00:17 (UTC+0)
signal strength 4 of 5

Corak Triple Bottom telah dibentuk pada carta EURUSD H1. Ciri-ciri corak: Garisan bawah corak mempunyai koordinat 1.1439 dengan had atas 1.1439/1.1357, unjuran lebar adalah 131 mata. Pembentukan corak Triple Bottom
Open chart in a new window


