

Corak sebenar

Triple Bottom
was formed on 24.04 at 10:00:17 (UTC+0)
signal strength 4 of 5

The Triple Bottom pattern has formed on the chart of EURUSD H1. Features of the pattern: The lower line of the pattern has coordinates 1.1439 with the upper limit 1.1439/1.1357, the projection of the width is 131 points. The formation of the Triple Bottom pattern most likely indicates a change in the trend from downward to upward. This means that in the event of a breakdown of the resistance level 1.1308, the price is most likely to continue the upward movement.
- All
- All
- Bearish Rectangle
- Bearish Symmetrical Triangle
- Bearish Symmetrical Triangle
- Bullish Rectangle
- Double Top
- Double Top
- Triple Bottom
- Triple Bottom
- Triple Top
- Triple Top
- All
- All
- Buy
- Sale
- All
- 1
- 2
- 3
- 4
- 5
Double Bottom
was formed on 02.06 at 15:34:51 (UTC+0)
signal strength 1 of 5
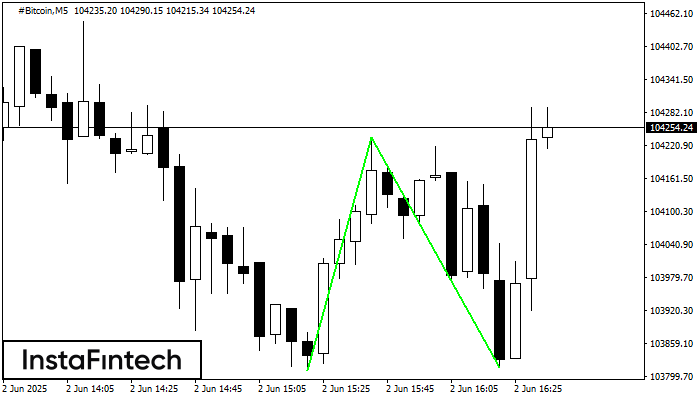
The Double Bottom pattern has been formed on #Bitcoin M5; the upper boundary is 104236.07; the lower boundary is 103815.25. The width of the pattern is 42583 points. In case
The M5 and M15 time frames may have more false entry points.
Open chart in a new window
Bullish Flag
was formed on 02.06 at 15:31:00 (UTC+0)
signal strength 1 of 5
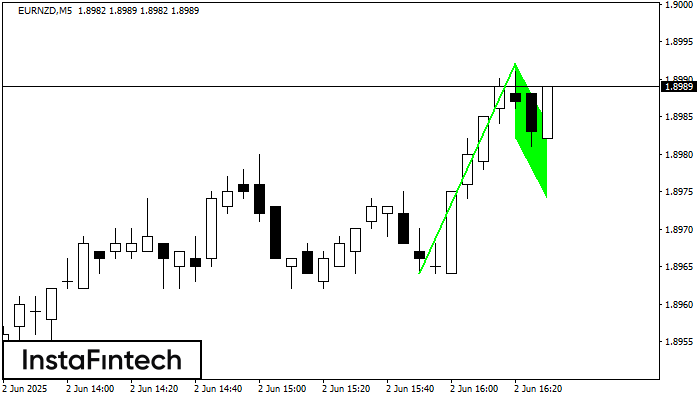
The Bullish Flag pattern has been formed on EURNZD at M5. The lower boundary of the pattern is located at 1.8982/1.8974, while the higher boundary lies at 1.8992/1.8984. The projection
The M5 and M15 time frames may have more false entry points.
Open chart in a new window
Bullish pennant
was formed on 02.06 at 15:30:54 (UTC+0)
signal strength 1 of 5
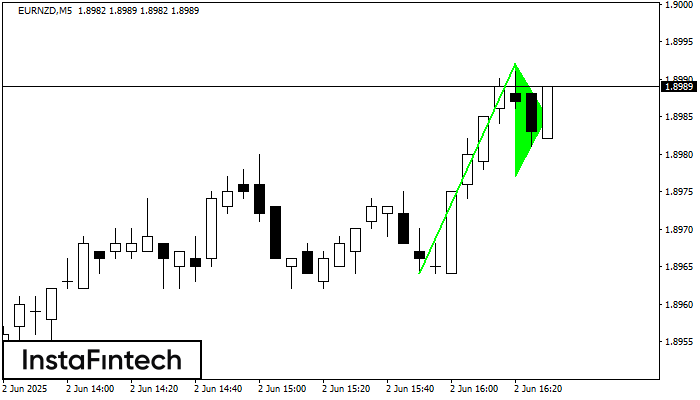
The Bullish pennant signal – Trading instrument EURNZD M5, continuation pattern. Forecast: it is possible to set up a buy position above the pattern’s high of 1.8992, with the prospect
The M5 and M15 time frames may have more false entry points.
Open chart in a new window

