

Corak sebenar

Bearish Symmetrical Triangle
was formed on 24.04 at 10:20:21 (UTC+0)
signal strength 1 of 5

According to the chart of M5, GOLD formed the Bearish Symmetrical Triangle pattern. Description: The lower border is 3314.14/3331.45 and upper border is 3343.45/3331.45. The pattern width is measured on the chart at -2931 pips. The formation of the Bearish Symmetrical Triangle pattern evidently signals a continuation of the downward trend. In other words, if the scenario comes true and GOLD breaches the lower border, the price could continue its move toward 3331.30.
The M5 and M15 time frames may have more false entry points.
Juga lihat
- All
- All
- Bearish Rectangle
- Bearish Symmetrical Triangle
- Bearish Symmetrical Triangle
- Bullish Rectangle
- Double Top
- Double Top
- Triple Bottom
- Triple Bottom
- Triple Top
- Triple Top
- All
- All
- Buy
- Sale
- All
- 1
- 2
- 3
- 4
- 5
Bullish Rectangle
was formed on 02.06 at 06:00:14 (UTC+0)
signal strength 2 of 5
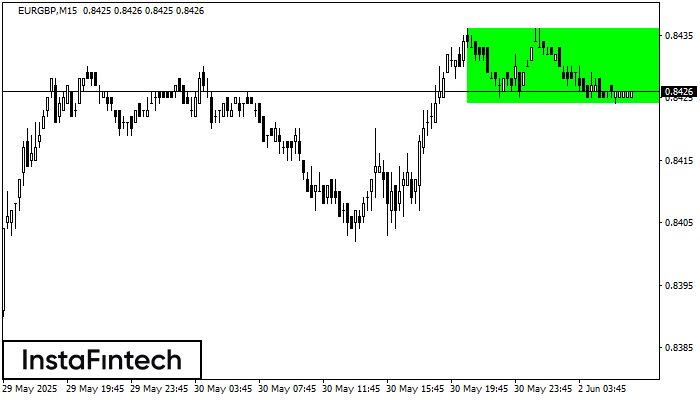
According to the chart of M15, EURGBP formed the Bullish Rectangle. This type of a pattern indicates a trend continuation. It consists of two levels: resistance 0.8436 and support 0.8424
The M5 and M15 time frames may have more false entry points.
Open chart in a new window
Triple Bottom
was formed on 02.06 at 06:00:03 (UTC+0)
signal strength 4 of 5
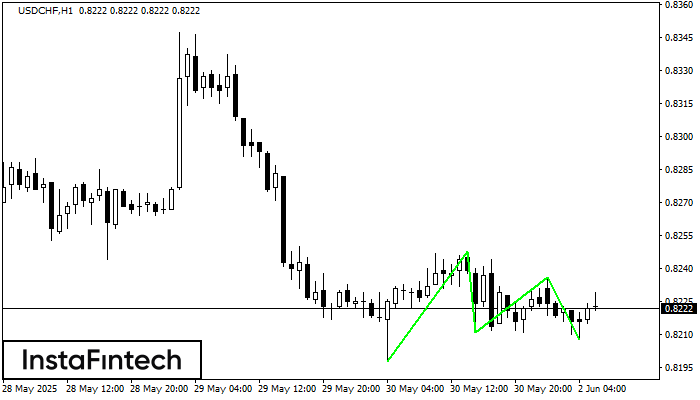
The Triple Bottom pattern has formed on the chart of the USDCHF H1 trading instrument. The pattern signals a change in the trend from downwards to upwards in the case
Open chart in a new window
Triple Bottom
was formed on 02.06 at 05:50:03 (UTC+0)
signal strength 1 of 5
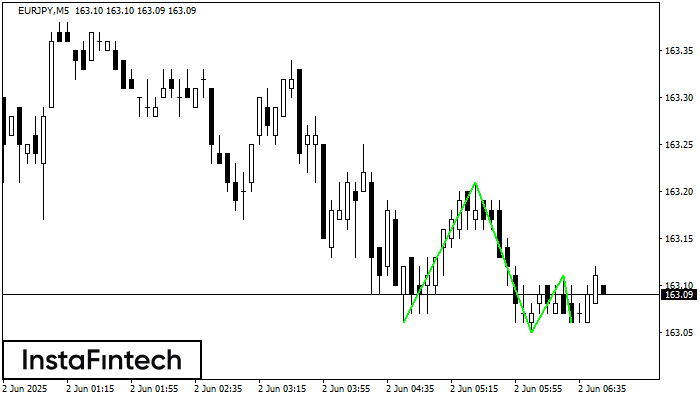
The Triple Bottom pattern has been formed on EURJPY M5. It has the following characteristics: resistance level 163.21/163.11; support level 163.06/163.06; the width is 15 points. In the event
The M5 and M15 time frames may have more false entry points.
Open chart in a new window

