

Pola sebenarnya

Double Bottom
was formed on 27.03 at 00:00:29 (UTC+0)
signal strength 3 of 5

The Double Bottom pattern has been formed on NZDCAD M30; the upper boundary is 0.8209; the lower boundary is 0.8165. The width of the pattern is 43 points. In case of a break of the upper boundary 0.8209, a change in the trend can be predicted where the width of the pattern will coincide with the distance to a possible take profit level.
Lihat juga
- All
- All
- Bearish Rectangle
- Bearish Symmetrical Triangle
- Bearish Symmetrical Triangle
- Bullish Rectangle
- Double Top
- Double Top
- Triple Bottom
- Triple Bottom
- Triple Top
- Triple Top
- All
- All
- Buy
- Sale
- All
- 1
- 2
- 3
- 4
- 5
Bawah Triple
was formed on 11.04 at 15:45:01 (UTC+0)
signal strength 2 of 5
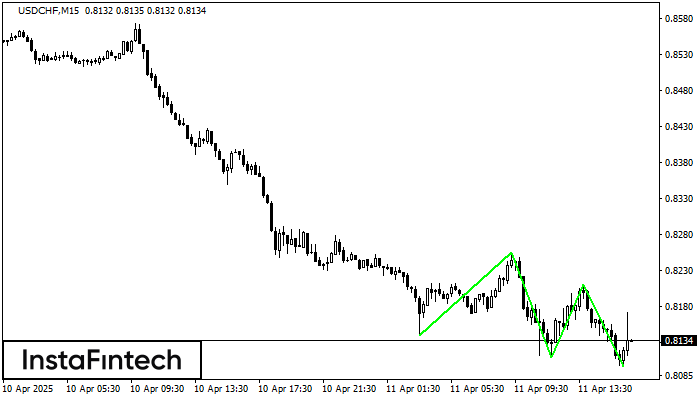
Pola Bawah Triple telah terbentuk pada grafik instrumen trading USDCHF M15. Pola tersebut menandakan perubahan dalam trend dari menurun menjadi naik jika terjadi pemecahan (breakdown) 0.8256/0.8211
Rangka waktu M5 dan M15 mungkin memiliki lebih dari titik entri yang keliru.
Open chart in a new window
Bawah Ganda
was formed on 11.04 at 15:25:04 (UTC+0)
signal strength 1 of 5
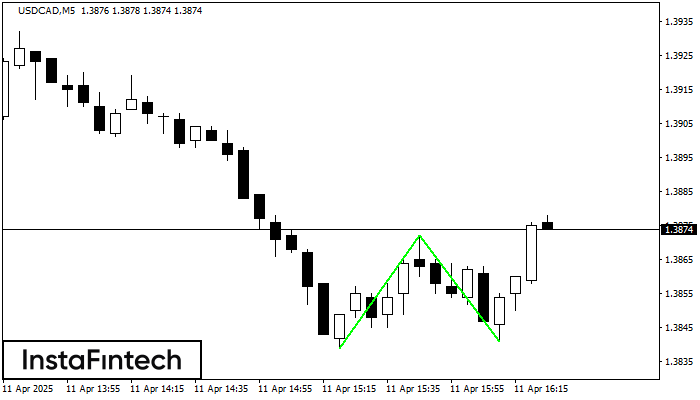
Pola Bawah Ganda telah terbentuk pada USDCAD M5. Karakteristik: level support 1.3839; level resistance 1.3872; lebar pola 33 poin. Jika level resistance ditembus, perubahan dalam tren dapat diprediksi dengan target
Rangka waktu M5 dan M15 mungkin memiliki lebih dari titik entri yang keliru.
Open chart in a new window
Persegi Bearish
was formed on 11.04 at 15:08:43 (UTC+0)
signal strength 4 of 5
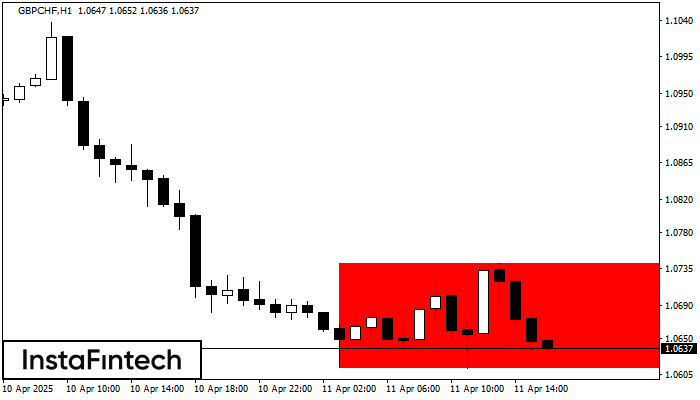
Menurut grafik dari H1, GBPCHF terbentuk Persegi Bearish. Pola menunjukkan kelanjutan tren. Batas atas adalah 1.0742, batas rendah adalah 1.0613. Sinyal berarti posisi jual harus dibuka setelah menetapkan harga dibawah
Open chart in a new window


