

Pola sebenarnya

Double Bottom
was formed on 11.04 at 15:25:04 (UTC+0)
signal strength 1 of 5
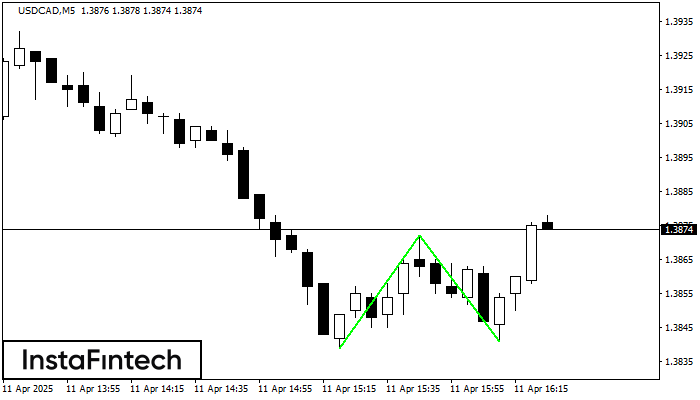
The Double Bottom pattern has been formed on USDCAD M5. Characteristics: the support level 1.3839; the resistance level 1.3872; the width of the pattern 33 points. If the resistance level is broken, a change in the trend can be predicted with the first target point lying at the distance of 31 points.
The M5 and M15 time frames may have more false entry points.
- All
- All
- Bearish Rectangle
- Bearish Symmetrical Triangle
- Bearish Symmetrical Triangle
- Bullish Rectangle
- Double Top
- Double Top
- Triple Bottom
- Triple Bottom
- Triple Top
- Triple Top
- All
- All
- Buy
- Sale
- All
- 1
- 2
- 3
- 4
- 5
Triple Bottom
was formed on 02.06 at 04:31:27 (UTC+0)
signal strength 2 of 5
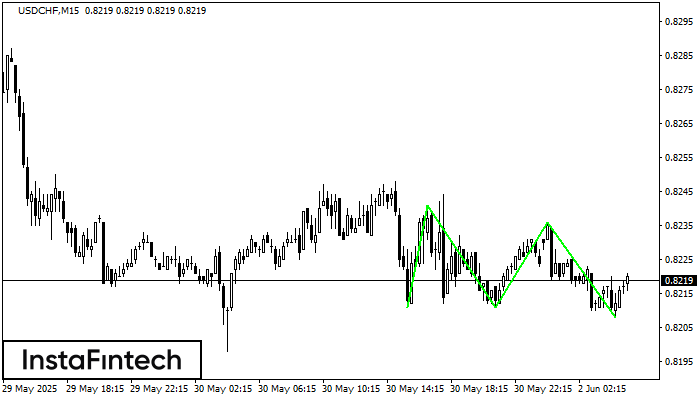
The Triple Bottom pattern has formed on the chart of the USDCHF M15 trading instrument. The pattern signals a change in the trend from downwards to upwards in the case
The M5 and M15 time frames may have more false entry points.
Open chart in a new window
Double Top
was formed on 02.06 at 03:20:17 (UTC+0)
signal strength 1 of 5
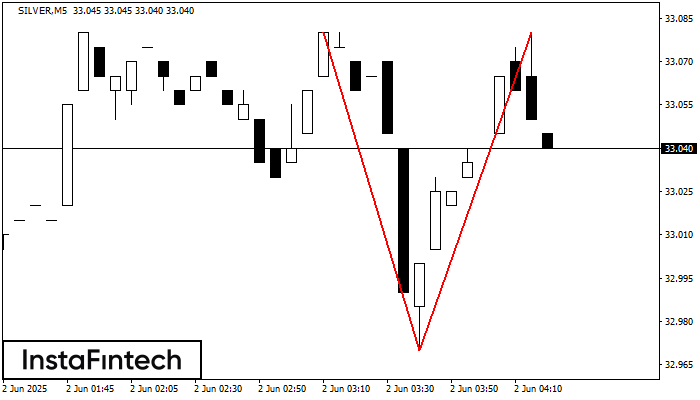
The Double Top pattern has been formed on SILVER M5. It signals that the trend has been changed from upwards to downwards. Probably, if the base of the pattern 32.97
The M5 and M15 time frames may have more false entry points.
Open chart in a new window
Bullish pennant
was formed on 02.06 at 02:15:09 (UTC+0)
signal strength 2 of 5
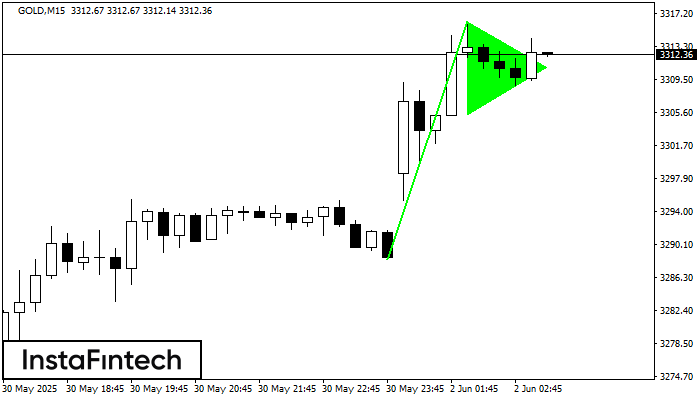
The Bullish pennant pattern is formed on the GOLD M15 chart. It is a type of the continuation pattern. Supposedly, in case the price is fixed above the pennant’s high
The M5 and M15 time frames may have more false entry points.
Open chart in a new window


