

Pola sebenarnya

Bearish Rectangle
was formed on 11.04 at 15:08:43 (UTC+0)
signal strength 4 of 5
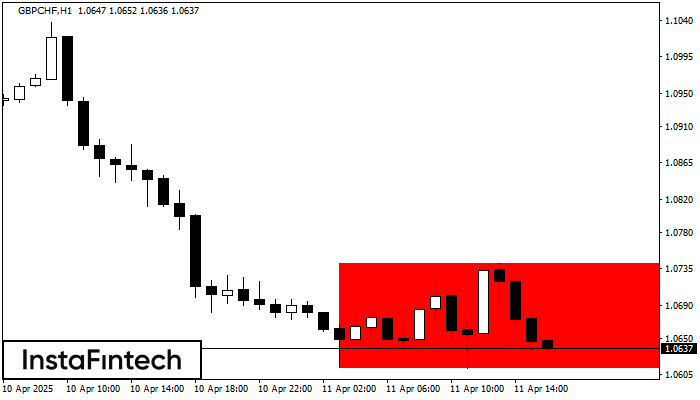
According to the chart of H1, GBPCHF formed the Bearish Rectangle. The pattern indicates a trend continuation. The upper border is 1.0742, the lower border is 1.0613. The signal means that a short position should be opened after fixing a price below the lower border 1.0613 of the Bearish Rectangle.
- All
- All
- Bearish Rectangle
- Bearish Symmetrical Triangle
- Bearish Symmetrical Triangle
- Bullish Rectangle
- Double Top
- Double Top
- Triple Bottom
- Triple Bottom
- Triple Top
- Triple Top
- All
- All
- Buy
- Sale
- All
- 1
- 2
- 3
- 4
- 5
Bawah Ganda
was formed on 21.05 at 06:45:15 (UTC+0)
signal strength 2 of 5
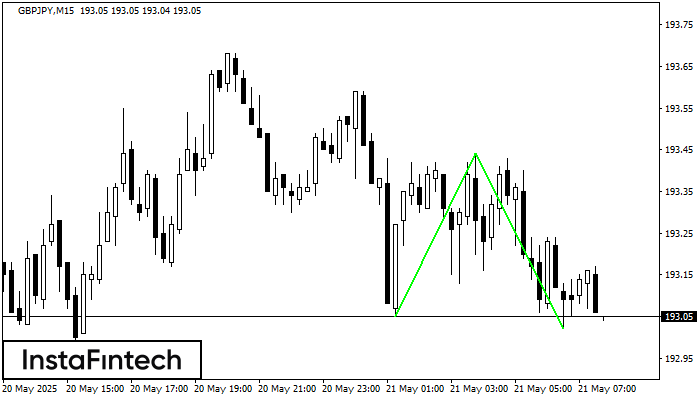
Pola Bawah Ganda telah terbentuk pada GBPJPY M15; batas atas di 193.44; batas bawah di 193.02. Lebar pola sebesar 39 poin. Jika harga menembus batas atas 193.44, Perubahan dalam tren
Rangka waktu M5 dan M15 mungkin memiliki lebih dari titik entri yang keliru.
Open chart in a new window
Segitiga Simetris Bearish
was formed on 21.05 at 06:17:36 (UTC+0)
signal strength 3 of 5
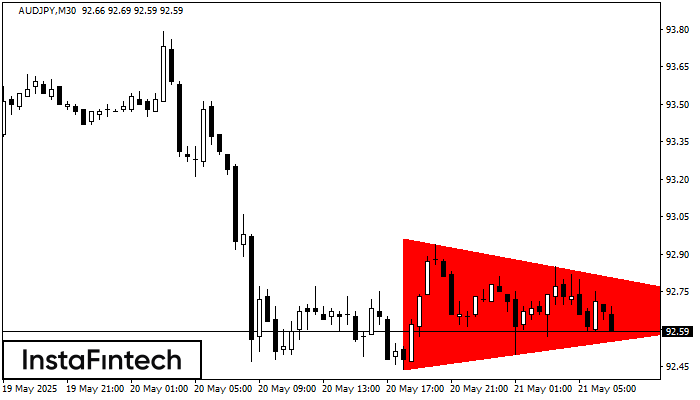
Menurut Grafik dari M30, AUDJPY dibentuk pola Segitiga Simetris Bearish. Deskripsi: Batas yang lebih rendah adalah 92.44/92.66 dan batas atas adalah 92.96/92.66. Lebar pola diukur dalam grafik di -52 pips
Open chart in a new window
Bawah Ganda
was formed on 21.05 at 06:05:21 (UTC+0)
signal strength 1 of 5
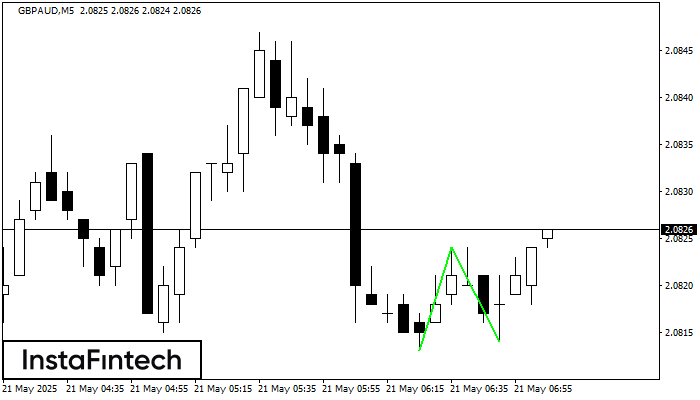
Pola Bawah Ganda telah terbentuk pada GBPAUD M5; batas atas di 2.0824; batas bawah di 2.0814. Lebar pola sebesar 11 poin. Jika harga menembus batas atas 2.0824, Perubahan dalam tren
Rangka waktu M5 dan M15 mungkin memiliki lebih dari titik entri yang keliru.
Open chart in a new window


