

实际模式

模式是通过价格在图表中形成的图形模型。 根据其中一项技术分析规定,历史(价格变动)重演。 这意味着价格变动在相同的情况下通常是相似的,这使得有可能以高概率预测情况的进一步发展。
InstaTrade的相关模式是一款易于使用的服务,可让您了解市场的最新变化并及时对市场线索做出反应。 在我们的服务中,您始终可以在任何货币对以及任何时间范围内找到最新和最相关的模式。
Bullish Symmetrical Triangle
was formed on 05.04 at 06:31:21 (UTC+0)
signal strength 2 of 5

According to the chart of M15, #Bitcoin formed the Bullish Symmetrical Triangle pattern. The lower border of the pattern touches the coordinates 83167.44/83888.94 whereas the upper border goes across 84422.11/83888.94. If the Bullish Symmetrical Triangle pattern is in progress, this evidently signals a further upward trend. In other words, in case the scenario comes true, the price of #Bitcoin will breach the upper border to head for 83889.16.
The M5 and M15 time frames may have more false entry points.
See Also
- All
- All
- Bearish Rectangle
- Bearish Symmetrical Triangle
- Bearish Symmetrical Triangle
- Bullish Rectangle
- Double Top
- Double Top
- Triple Bottom
- Triple Bottom
- Triple Top
- Triple Top
- All
- All
- Buy
- Sale
- All
- 1
- 2
- 3
- 4
- 5
Bawah Triple
was formed on 11.04 at 15:45:01 (UTC+0)
signal strength 2 of 5
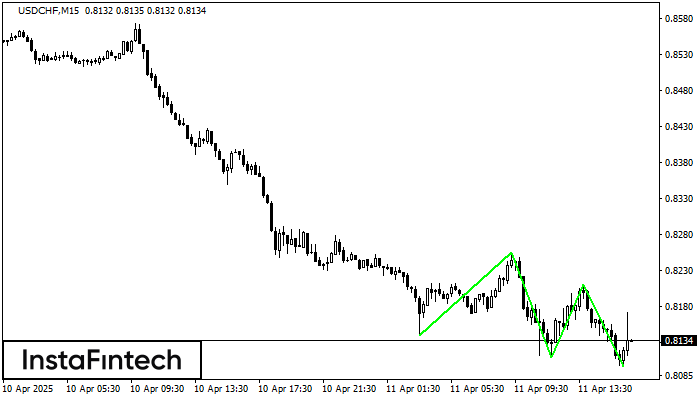
Pola Bawah Triple telah terbentuk pada grafik instrumen trading USDCHF M15. Pola tersebut menandakan perubahan dalam trend dari menurun menjadi naik jika terjadi pemecahan (breakdown) 0.8256/0.8211
Rangka waktu M5 dan M15 mungkin memiliki lebih dari titik entri yang keliru.
Open chart in a new window
Bawah Ganda
was formed on 11.04 at 15:25:04 (UTC+0)
signal strength 1 of 5
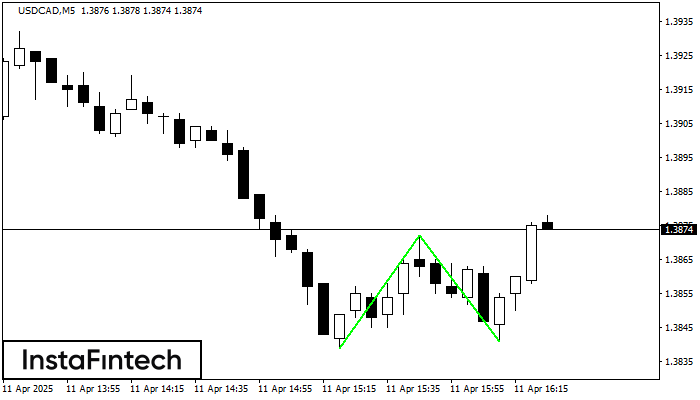
Pola Bawah Ganda telah terbentuk pada USDCAD M5. Karakteristik: level support 1.3839; level resistance 1.3872; lebar pola 33 poin. Jika level resistance ditembus, perubahan dalam tren dapat diprediksi dengan target
Rangka waktu M5 dan M15 mungkin memiliki lebih dari titik entri yang keliru.
Open chart in a new window
Persegi Bearish
was formed on 11.04 at 15:08:43 (UTC+0)
signal strength 4 of 5
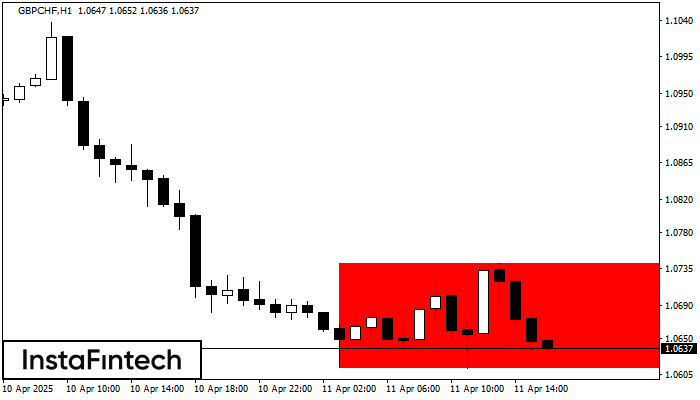
Menurut grafik dari H1, GBPCHF terbentuk Persegi Bearish. Pola menunjukkan kelanjutan tren. Batas atas adalah 1.0742, batas rendah adalah 1.0613. Sinyal berarti posisi jual harus dibuka setelah menetapkan harga dibawah
Open chart in a new window


