

Các mẫu thực tế

Các mẫu là các mô hình đồ họa được hình thành trong biểu đồ theo giá. Theo một trong những định đề phân tích kỹ thuật, lịch sử (chuyển động giá) thường tự lặp lại. Có nghĩa là biến động giá thường giống nhau trong các tình huống giống nhau, do đó có thể dự đoán chuyển động tiếp theo của tình huống với xác suất cao.
Các mẫu hữu quan của InstaTrade là một dịch vụ dễ sử dụng cho phép bạn nhận biết được những thay đổi mới nhất trên thị trường và phản ứng kịp thời với các dấu hiệu từ thị trường. Trong dịch vụ của chúng tôi, bạn sẽ luôn tìm thấy các mẫu mới nhất và phù hợp nhất trên bất kỳ cặp nào và bất kỳ khung thời gian nào.
Bullish Rectangle
was formed on 01.04 at 21:16:19 (UTC+0)
signal strength 2 of 5
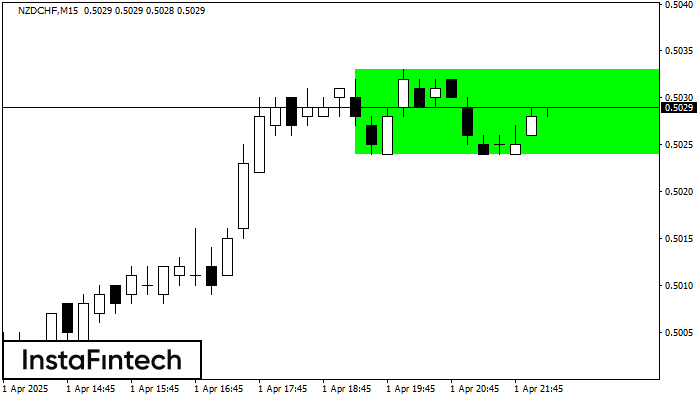
According to the chart of M15, NZDCHF formed the Bullish Rectangle. This type of a pattern indicates a trend continuation. It consists of two levels: resistance 0.5033 and support 0.5024. In case the resistance level 0.5033 - 0.5033 is broken, the instrument is likely to follow the bullish trend.
The M5 and M15 time frames may have more false entry points.
- All
- All
- Bearish Rectangle
- Bearish Symmetrical Triangle
- Bearish Symmetrical Triangle
- Bullish Rectangle
- Double Top
- Double Top
- Triple Bottom
- Triple Bottom
- Triple Top
- Triple Top
- All
- All
- Buy
- Sale
- All
- 1
- 2
- 3
- 4
- 5
Triple Bottom
сформирован 25.04 в 12:29:55 (UTC+0)
сила сигнала 2 из 5

The Triple Bottom pattern has formed on the chart of GOLD M15. Features of the pattern: The lower line of the pattern has coordinates 3314.04 with the upper limit 3314.04/3308.41
The M5 and M15 time frames may have more false entry points.
Открыть график инструмента в новом окне
Triple Bottom
сформирован 25.04 в 11:55:08 (UTC+0)
сила сигнала 1 из 5
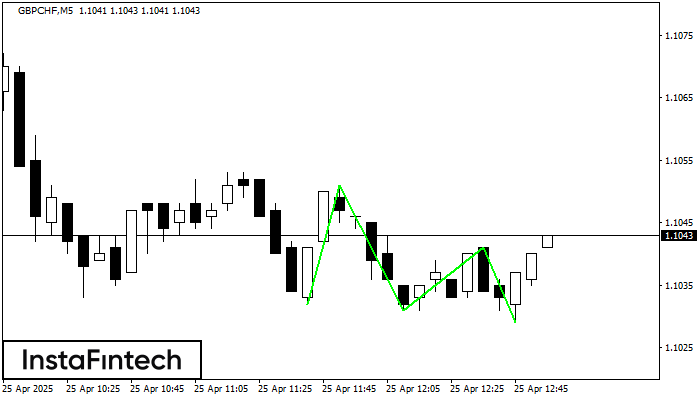
The Triple Bottom pattern has been formed on GBPCHF M5. It has the following characteristics: resistance level 1.1051/1.1041; support level 1.1032/1.1029; the width is 19 points. In the event
The M5 and M15 time frames may have more false entry points.
Открыть график инструмента в новом окне
Double Top
сформирован 25.04 в 11:40:02 (UTC+0)
сила сигнала 1 из 5
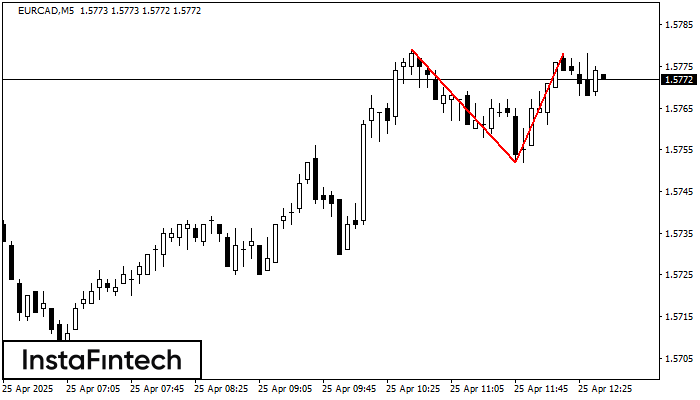
On the chart of EURCAD M5 the Double Top reversal pattern has been formed. Characteristics: the upper boundary 1.5778; the lower boundary 1.5752; the width of the pattern 26 points
The M5 and M15 time frames may have more false entry points.
Открыть график инструмента в новом окне
