

Өзекті паттерндер

Тройное дно
сформирован 25.04 в 11:55:08 (UTC+0)
сила сигнала 1 из 5
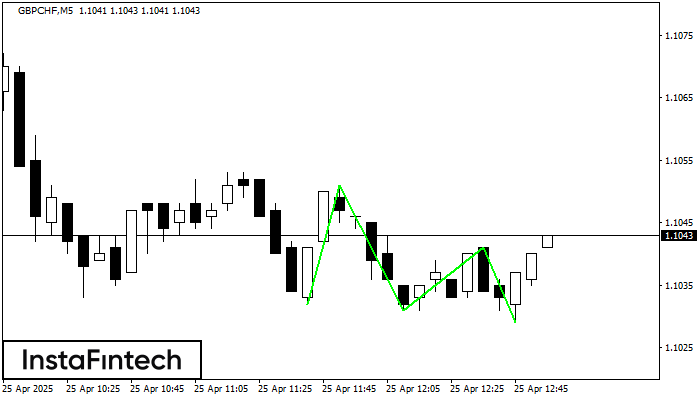
По торговому инструменту GBPCHF на M5 была сформирована графическая фигура «Тройное дно» с характеристиками: Уровень сопротивления 1.1041; Уровень поддержки 1.1029; Ширина 12 пунктов. В случае пробоя уровня сопротивления 1.1051 котировка, скорее всего, продолжит восходящее движение как минимум на 20 пунктов.
Таймфреймы М5 и М15 могут иметь больше ложных точек входа.
Сондай-ақ қараңыз
- Все
- Все
- Bearish Rectangle
- Bearish Symmetrical Triangle
- Bearish Symmetrical Triangle
- Bullish Rectangle
- Double Top
- Double Top
- Triple Bottom
- Triple Bottom
- Triple Top
- Triple Top
- Все
- Все
- Покупка
- Продажа
- Все
- 1
- 2
- 3
- 4
- 5
Triple Top
сформирован 01.06 в 02:15:04 (UTC+0)
сила сигнала 2 из 5

On the chart of the #Bitcoin M15 trading instrument, the Triple Top pattern that signals a trend change has formed. It is possible that after formation of the third peak
The M5 and M15 time frames may have more false entry points.
Открыть график инструмента в новом окне
Double Top
сформирован 01.06 в 01:00:35 (UTC+0)
сила сигнала 3 из 5

The Double Top reversal pattern has been formed on #Bitcoin M30. Characteristics: the upper boundary 104800.13; the lower boundary 104215.56; the width of the pattern is 64024 points. Sell trades
Открыть график инструмента в новом окне
Bullish Rectangle
сформирован 31.05 в 19:15:46 (UTC+0)
сила сигнала 1 из 5

According to the chart of M5, #Bitcoin formed the Bullish Rectangle which is a pattern of a trend continuation. The pattern is contained within the following borders: the lower border
The M5 and M15 time frames may have more false entry points.
Открыть график инструмента в новом окне


