

Patrones actuales

Los patrones son modelos gráficos que se forman en el gráfico mediante el precio. Según uno de los postulados del análisis técnico, la historia (movimiento del precio) se repite. Esto quiere decir que los movimientos del precio a menudo son similares en las mismas situaciones que hacen posible pronosticar el futuro desarrollo de la situación con una alta probabilidad.
Los patrones relevantes de InstaTrade son un servicio fácil de utilizar que permiten que conozca los últimos cambios en el mercado y reaccione a las pistas del mercado a tiempo. En nuestro servicio, siempre encontrará los últimos y más importantes patrones en cualquier par y en cualquier marco de tiempo.
Triple Top
was formed on 07.04 at 06:30:25 (UTC+0)
signal strength 1 of 5
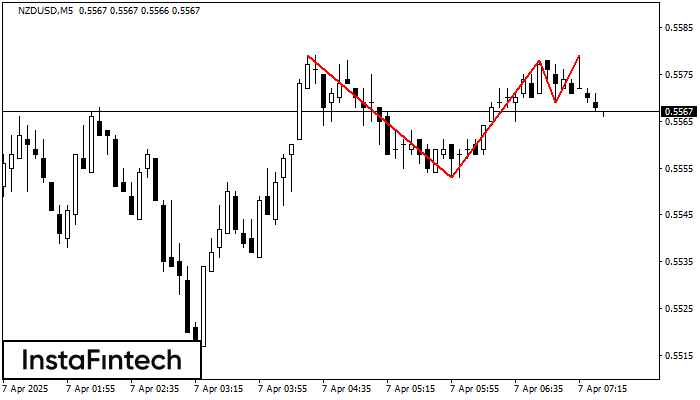
The Triple Top pattern has formed on the chart of the NZDUSD M5. Features of the pattern: borders have an ascending angle; the lower line of the pattern has the coordinates 0.5553/0.5569 with the upper limit 0.5579/0.5579; the projection of the width is 26 points. The formation of the Triple Top figure most likely indicates a change in the trend from upward to downward. This means that in the event of a breakdown of the support level of 0.5553, the price is most likely to continue the downward movement.
The M5 and M15 time frames may have more false entry points.
- All
- All
- Bearish Rectangle
- Bearish Symmetrical Triangle
- Bearish Symmetrical Triangle
- Bullish Rectangle
- Double Top
- Double Top
- Triple Bottom
- Triple Bottom
- Triple Top
- Triple Top
- All
- All
- Buy
- Sale
- All
- 1
- 2
- 3
- 4
- 5
Bearish Symmetrical Triangle
was formed on 16.04 at 18:27:06 (UTC+0)
signal strength 2 of 5
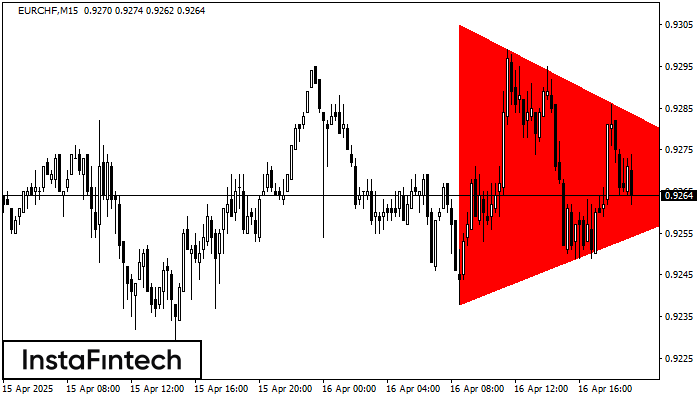
According to the chart of M15, EURCHF formed the Bearish Symmetrical Triangle pattern. This pattern signals a further downward trend in case the lower border 0.9238 is breached. Here
The M5 and M15 time frames may have more false entry points.
Open chart in a new window
Double Top
was formed on 16.04 at 18:20:05 (UTC+0)
signal strength 1 of 5
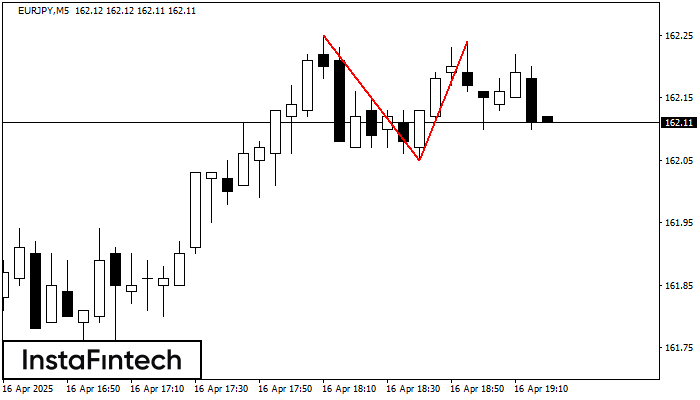
On the chart of EURJPY M5 the Double Top reversal pattern has been formed. Characteristics: the upper boundary 162.24; the lower boundary 162.05; the width of the pattern 19 points
The M5 and M15 time frames may have more false entry points.
Open chart in a new window
Bearish pennant
was formed on 16.04 at 18:15:34 (UTC+0)
signal strength 2 of 5
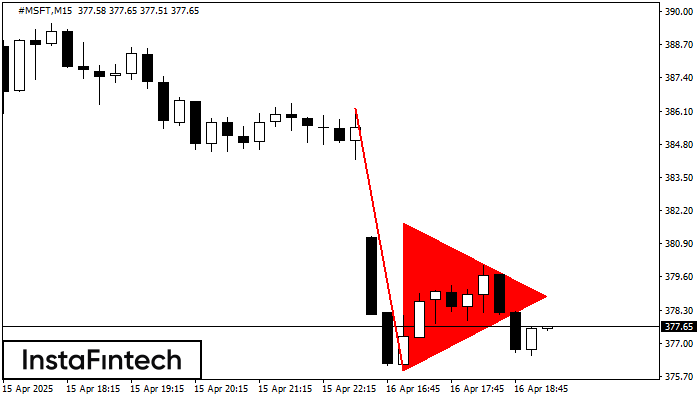
The Bearish pennant pattern has formed on the #MSFT M15 chart. This pattern type is characterized by a slight slowdown after which the price will move in the direction
The M5 and M15 time frames may have more false entry points.
Open chart in a new window
Bearish pennant
was formed on 16.04 at 18:00:05 (UTC+0)
signal strength 2 of 5
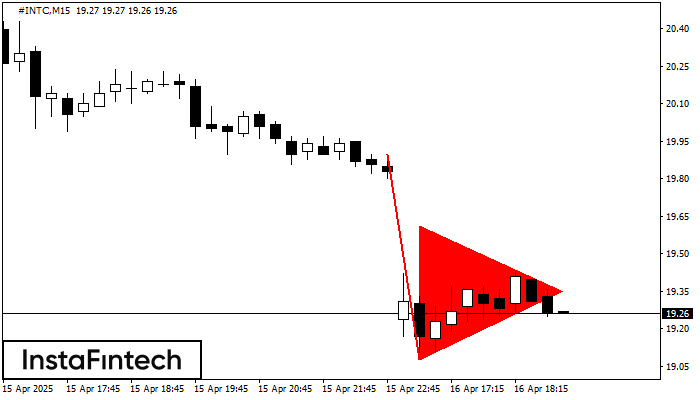
The Bearish pennant pattern has formed on the #INTC M15 chart. It signals potential continuation of the existing trend. Specifications: the pattern’s bottom has the coordinate of 19.08; the projection
The M5 and M15 time frames may have more false entry points.
Open chart in a new window
Triple Top
was formed on 16.04 at 17:50:25 (UTC+0)
signal strength 1 of 5
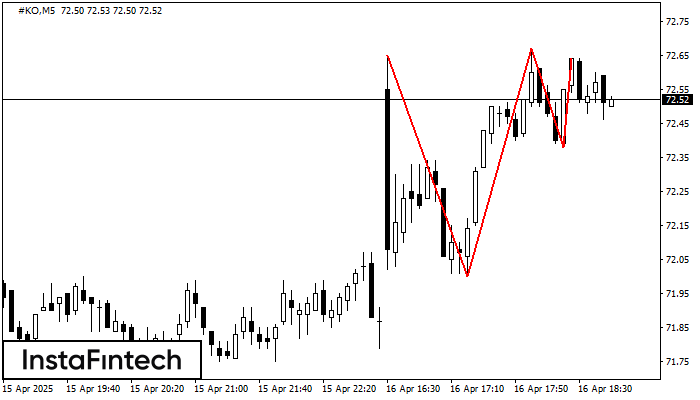
The Triple Top pattern has formed on the chart of the #KO M5 trading instrument. It is a reversal pattern featuring the following characteristics: resistance level 1, support level -38
The M5 and M15 time frames may have more false entry points.
Open chart in a new window
Double Top
was formed on 16.04 at 17:20:23 (UTC+0)
signal strength 1 of 5
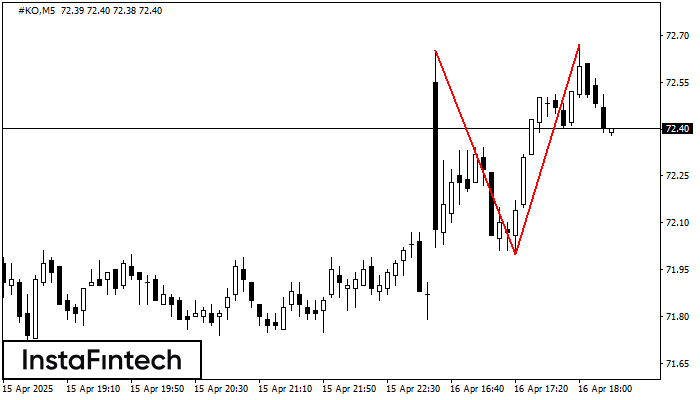
The Double Top pattern has been formed on #KO M5. It signals that the trend has been changed from upwards to downwards. Probably, if the base of the pattern 72.00
The M5 and M15 time frames may have more false entry points.
Open chart in a new window
Bearish Flag
was formed on 16.04 at 17:05:48 (UTC+0)
signal strength 2 of 5
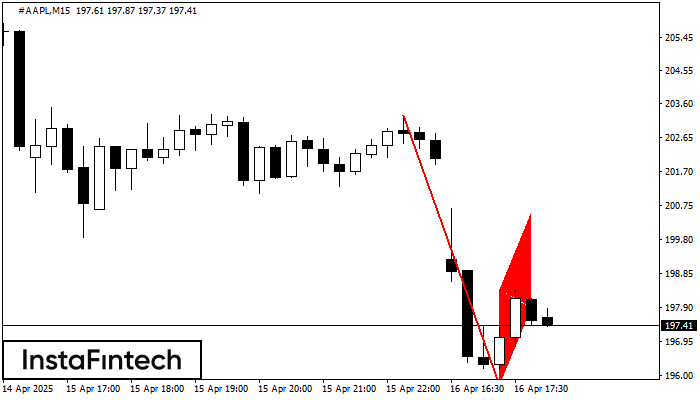
The Bearish Flag pattern has been formed on the chart #AAPL M15. Therefore, the downwards trend is likely to continue in the nearest term. As soon as the price breaks
The M5 and M15 time frames may have more false entry points.
Open chart in a new window
Bearish pennant
was formed on 16.04 at 17:05:44 (UTC+0)
signal strength 2 of 5
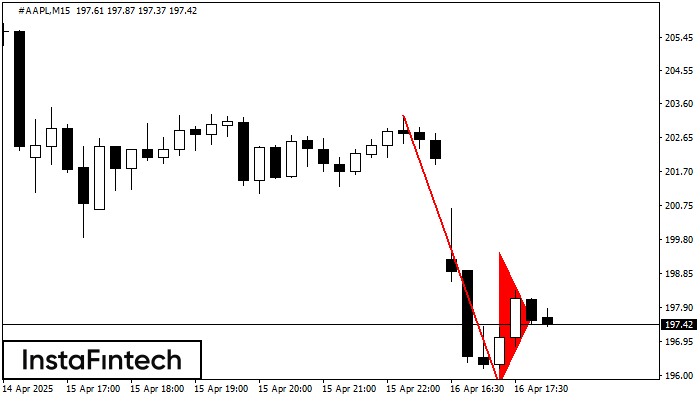
The Bearish pennant pattern has formed on the #AAPL M15 chart. This pattern type is characterized by a slight slowdown after which the price will move in the direction
The M5 and M15 time frames may have more false entry points.
Open chart in a new window
Double Top
was formed on 16.04 at 17:05:31 (UTC+0)
signal strength 1 of 5
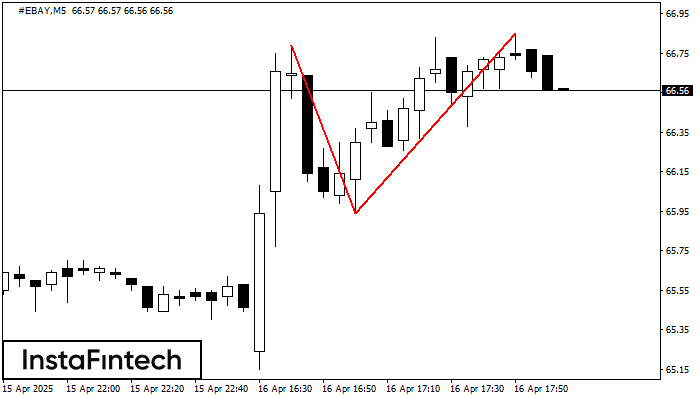
The Double Top reversal pattern has been formed on #EBAY M5. Characteristics: the upper boundary 66.79; the lower boundary 65.94; the width of the pattern is 91 points. Sell trades
The M5 and M15 time frames may have more false entry points.
Open chart in a new window


