

Actual patterns

Patterns are graphical models which are formed in the chart by the price. According to one of the technical analysis postulates, history (price movement) repeats itself. It means that the price movements are often similar in the same situations which makes it possible to predict the further development of the situation with a high probability.
Relevant patterns by InstaTrade is an easy-to-use service which allows you to be aware of latest changes in the market and react to clues from the market in time. In our service you will always find the latest and most relevant patterns on any pair and any timeframe.
Bearish pennant
was formed on 16.04 at 18:00:05 (UTC+0)
signal strength 2 of 5
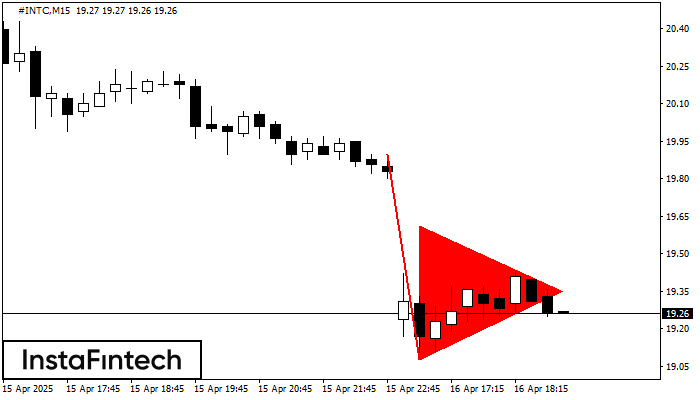
The Bearish pennant pattern has formed on the #INTC M15 chart. It signals potential continuation of the existing trend. Specifications: the pattern’s bottom has the coordinate of 19.08; the projection of the flagpole height is equal to 82 pips. In case the price breaks out the pattern’s bottom of 19.08, the downtrend is expected to continue for further level 18.85.
The M5 and M15 time frames may have more false entry points.
See Also
- All
- All
- Bearish Rectangle
- Bearish Symmetrical Triangle
- Bearish Symmetrical Triangle
- Bullish Rectangle
- Double Top
- Double Top
- Triple Bottom
- Triple Bottom
- Triple Top
- Triple Top
- All
- All
- Buy
- Sale
- All
- 1
- 2
- 3
- 4
- 5
Teratas Ganda
was formed on 26.05 at 02:30:39 (UTC+0)
signal strength 3 of 5
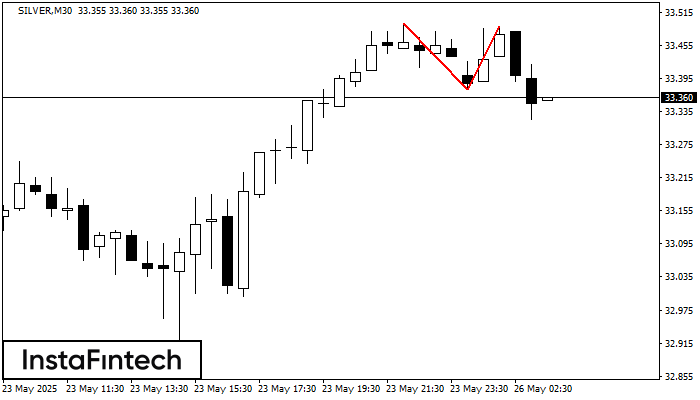
Pola Teratas Ganda telah terbentuk pada SILVER M30. Pola ini menandakan bahwa tren telah berubah dari kenaikan menjadi penurunan. Mungkin, jika dasar pola di 33.38 ditembus, maka pergerakan menurun akan
Open chart in a new window
Bawah Ganda
was formed on 26.05 at 02:30:11 (UTC+0)
signal strength 3 of 5
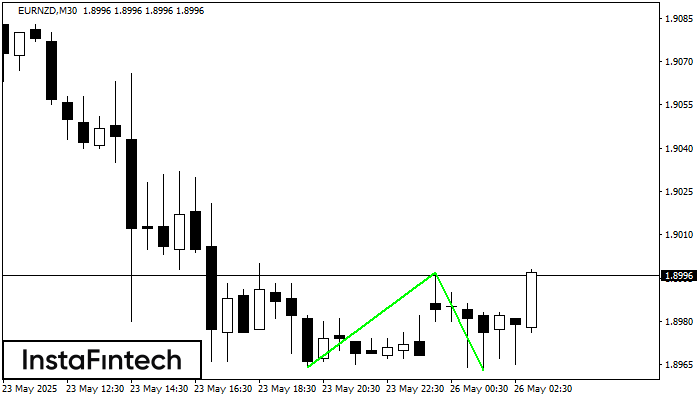
Pola Bawah Ganda telah terbentuk pada EURNZD M30. Karakteristik: level support 1.8964; level resistance 1.8997; lebar pola 33 poin. Jika level resistance ditembus, perubahan dalam tren dapat diprediksi dengan target
Open chart in a new window
Teratas Ganda
was formed on 26.05 at 02:00:51 (UTC+0)
signal strength 2 of 5
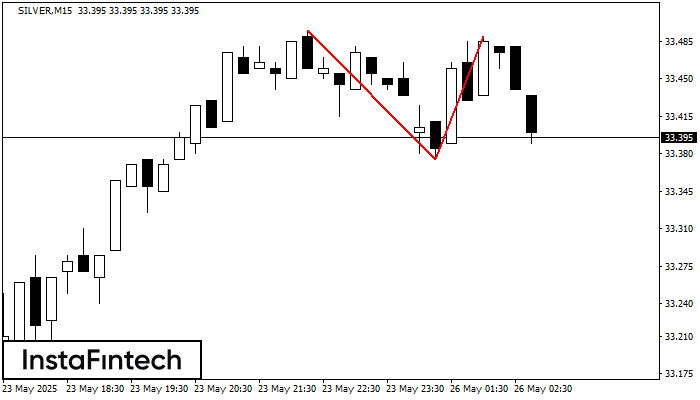
Pada grafik SILVER M15 pola reversal Teratas Ganda telah terbentuk. Karakteristik: batas atas 33.49; batas bawah 33.38; lebar pola 115 poin. Sinyal: tembusan ke batas bawah akan menyebabkan kelanjutan tren
Rangka waktu M5 dan M15 mungkin memiliki lebih dari titik entri yang keliru.
Open chart in a new window


