

Actual patterns

Patterns are graphical models which are formed in the chart by the price. According to one of the technical analysis postulates, history (price movement) repeats itself. It means that the price movements are often similar in the same situations which makes it possible to predict the further development of the situation with a high probability.
Relevant patterns by InstaTrade is an easy-to-use service which allows you to be aware of latest changes in the market and react to clues from the market in time. In our service you will always find the latest and most relevant patterns on any pair and any timeframe.
Bullish Symmetrical Triangle
was formed on 01.04 at 11:03:47 (UTC+0)
signal strength 3 of 5

According to the chart of M30, GBPUSD formed the Bullish Symmetrical Triangle pattern. The lower border of the pattern touches the coordinates 1.2876/1.2915 whereas the upper border goes across 1.2971/1.2915. If the Bullish Symmetrical Triangle pattern is in progress, this evidently signals a further upward trend. In other words, in case the scenario comes true, the price of GBPUSD will breach the upper border to head for 1.2945.
- All
- All
- Bearish Rectangle
- Bearish Symmetrical Triangle
- Bearish Symmetrical Triangle
- Bullish Rectangle
- Double Top
- Double Top
- Triple Bottom
- Triple Bottom
- Triple Top
- Triple Top
- All
- All
- Buy
- Sale
- All
- 1
- 2
- 3
- 4
- 5
Bearish Symmetrical Triangle
was formed on 16.04 at 18:27:06 (UTC+0)
signal strength 2 of 5
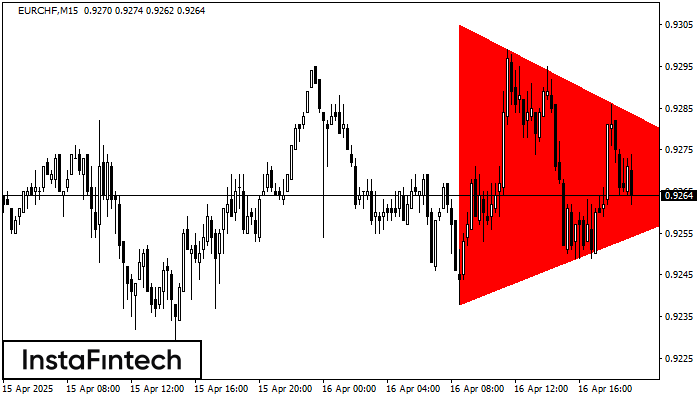
According to the chart of M15, EURCHF formed the Bearish Symmetrical Triangle pattern. This pattern signals a further downward trend in case the lower border 0.9238 is breached. Here
The M5 and M15 time frames may have more false entry points.
Open chart in a new window
Double Top
was formed on 16.04 at 18:20:05 (UTC+0)
signal strength 1 of 5
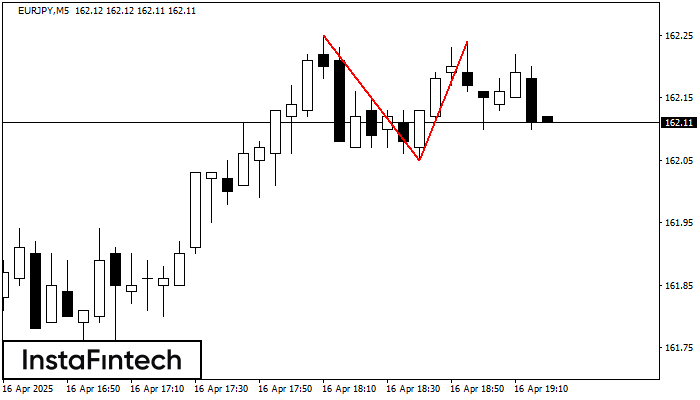
On the chart of EURJPY M5 the Double Top reversal pattern has been formed. Characteristics: the upper boundary 162.24; the lower boundary 162.05; the width of the pattern 19 points
The M5 and M15 time frames may have more false entry points.
Open chart in a new window
Bearish pennant
was formed on 16.04 at 18:15:34 (UTC+0)
signal strength 2 of 5
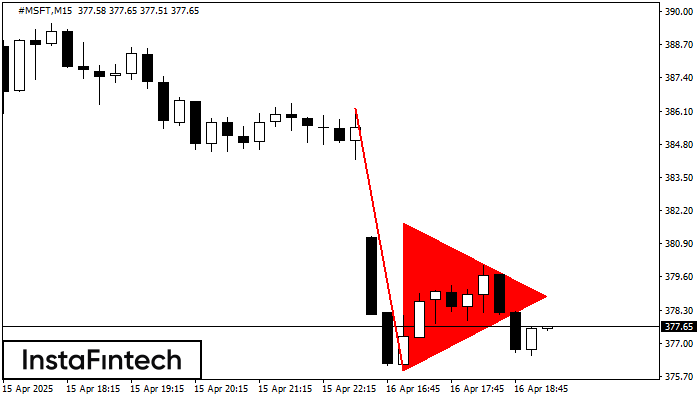
The Bearish pennant pattern has formed on the #MSFT M15 chart. This pattern type is characterized by a slight slowdown after which the price will move in the direction
The M5 and M15 time frames may have more false entry points.
Open chart in a new window
Bearish pennant
was formed on 16.04 at 18:00:05 (UTC+0)
signal strength 2 of 5
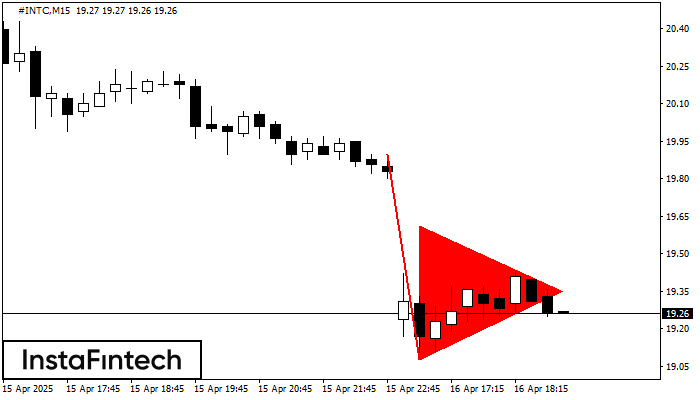
The Bearish pennant pattern has formed on the #INTC M15 chart. It signals potential continuation of the existing trend. Specifications: the pattern’s bottom has the coordinate of 19.08; the projection
The M5 and M15 time frames may have more false entry points.
Open chart in a new window
Triple Top
was formed on 16.04 at 17:50:25 (UTC+0)
signal strength 1 of 5
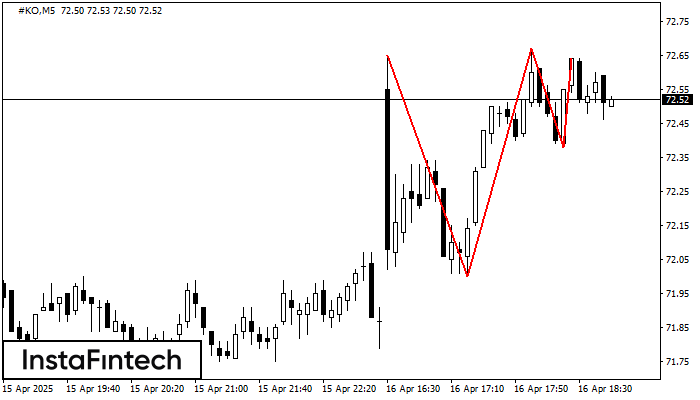
The Triple Top pattern has formed on the chart of the #KO M5 trading instrument. It is a reversal pattern featuring the following characteristics: resistance level 1, support level -38
The M5 and M15 time frames may have more false entry points.
Open chart in a new window
Double Top
was formed on 16.04 at 17:20:23 (UTC+0)
signal strength 1 of 5
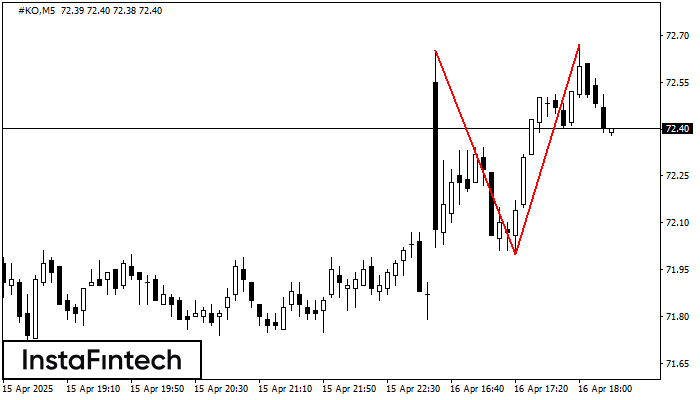
The Double Top pattern has been formed on #KO M5. It signals that the trend has been changed from upwards to downwards. Probably, if the base of the pattern 72.00
The M5 and M15 time frames may have more false entry points.
Open chart in a new window
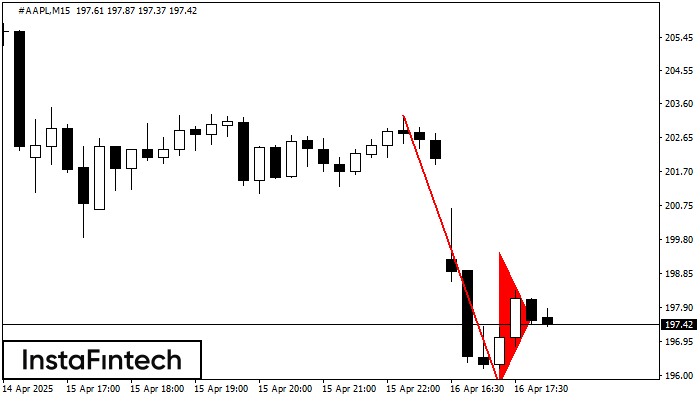
Bearish Flag
was formed on 16.04 at 17:05:48 (UTC+0)
signal strength 2 of 5
The Bearish Flag pattern has been formed on the chart #AAPL M15. Therefore, the downwards trend is likely to continue in the nearest term. As soon as the price breaks
The M5 and M15 time frames may have more false entry points.
Open chart in a new window
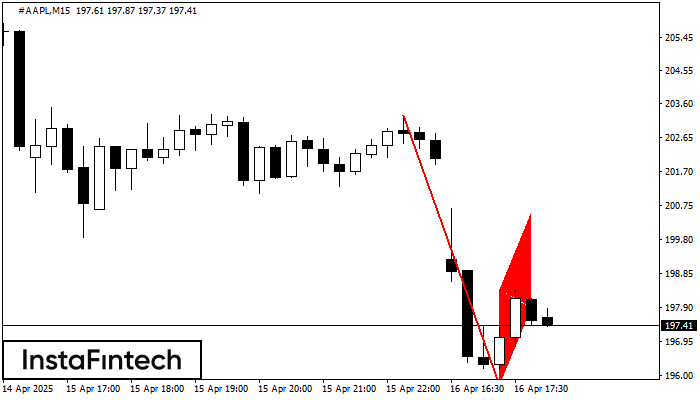
Bearish pennant
was formed on 16.04 at 17:05:44 (UTC+0)
signal strength 2 of 5
The Bearish pennant pattern has formed on the #AAPL M15 chart. This pattern type is characterized by a slight slowdown after which the price will move in the direction
The M5 and M15 time frames may have more false entry points.
Open chart in a new window
Double Top
was formed on 16.04 at 17:05:31 (UTC+0)
signal strength 1 of 5
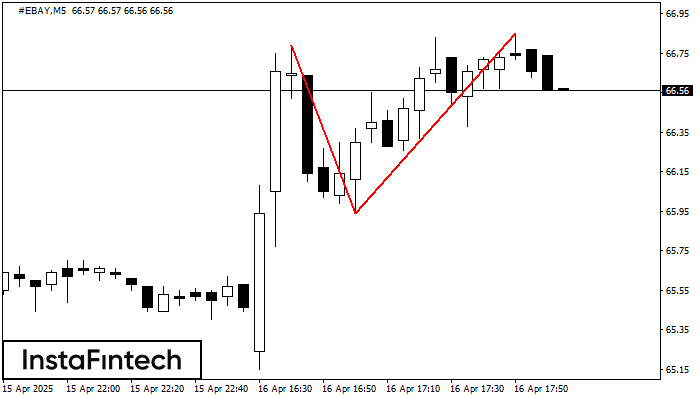
The Double Top reversal pattern has been formed on #EBAY M5. Characteristics: the upper boundary 66.79; the lower boundary 65.94; the width of the pattern is 91 points. Sell trades
The M5 and M15 time frames may have more false entry points.
Open chart in a new window


