

Corak sebenar

Triple Bottom
was formed on 03.04 at 02:10:27 (UTC+0)
signal strength 1 of 5
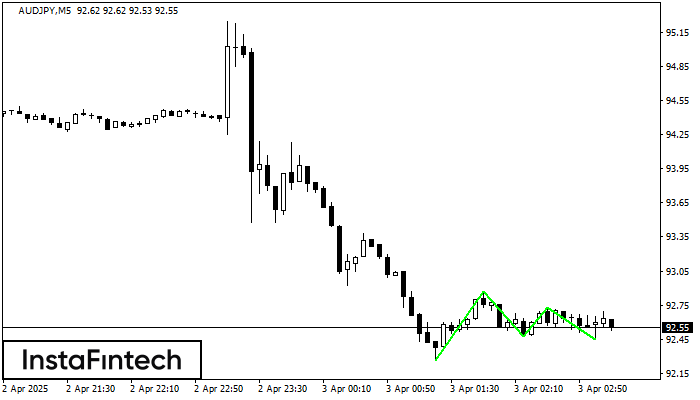
The Triple Bottom pattern has been formed on AUDJPY M5. It has the following characteristics: resistance level 92.87/92.73; support level 92.26/92.45; the width is 61 points. In the event of a breakdown of the resistance level of 92.87, the price is likely to continue an upward movement at least to 92.62.
The M5 and M15 time frames may have more false entry points.
Juga lihat
- All
- All
- Bearish Rectangle
- Bearish Symmetrical Triangle
- Bearish Symmetrical Triangle
- Bullish Rectangle
- Double Top
- Double Top
- Triple Bottom
- Triple Bottom
- Triple Top
- Triple Top
- All
- All
- Buy
- Sale
- All
- 1
- 2
- 3
- 4
- 5
डबल टॉप
was formed on 22.04 at 21:25:11 (UTC+0)
signal strength 1 of 5

#Bitcoin M5 के चार्ट पर डबल टॉप रीवर्सल पैटर्न बना है। विशेषताएं: ऊपरी सीमा 91658.42; निचली सीमा 91095.99; पैटर्न की चौड़ाई 56243 पॉइंट्स। संकेत: निचली सीमा के टूटने से 91095.84
M5 और M15 समय सीमा में अधिक फाल्स एंट्री पॉइंट्स हो सकते हैं।
Open chart in a new window
बियरिश सिमेट्रिकल त्रिभुज
was formed on 22.04 at 21:15:28 (UTC+0)
signal strength 1 of 5

M5 के चार्ट के अनुसार, EURNZD से बियरिश सिमेट्रिकल त्रिभुज पैटर्न बना। विवरण: निचली सीमा 1.9072/1.9108 है और ऊपरी सीमा 1.9137/1.9108 है। पैटर्न की चौड़ाई चार्ट पर -65 पिप्स
M5 और M15 समय सीमा में अधिक फाल्स एंट्री पॉइंट्स हो सकते हैं।
Open chart in a new window
डबल टॉप
was formed on 22.04 at 20:40:40 (UTC+0)
signal strength 1 of 5
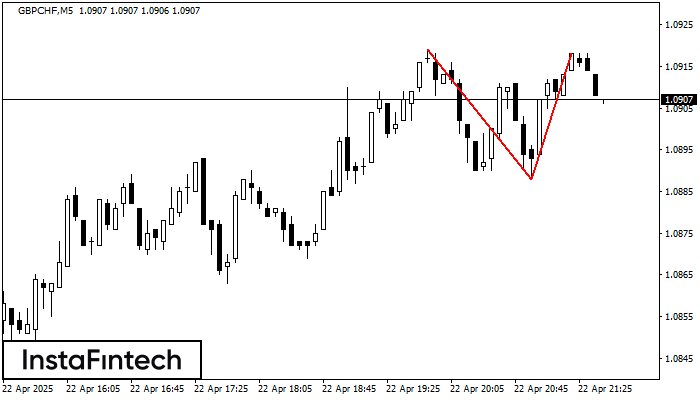
डबल टॉप पैटर्न GBPCHF M5 पर बना है। यह संकेत देता है कि प्रवृत्ति ऊपर से नीचे की ओर बदल गई है। संभवतः, यदि 1.0888 पैटर्न का आधार टूट जाता
M5 और M15 समय सीमा में अधिक फाल्स एंट्री पॉइंट्स हो सकते हैं।
Open chart in a new window


