

वास्तविक पैटर्न

पैटर्न ग्राफिकल मॉडल हैं जो चार्ट में मूल्य से बने होते हैं। तकनीकी विश्लेषण भविष्यवाणियों में से एक के अनुसार, इतिहास का मतलब मूल्य आंदोलन खुद को दोहराता है। इसका मतलब है कि मूल्य आंदोलन अक्सर एक ही परिस्थितियों में समान होते हैं जो उच्च संभावना के साथ स्थिति के आगे के विकास की भविष्यवाणी करना संभव बनाता है।
इंस्टा फॉरेक्स द्वारा प्रासंगिक पैटर्न एक उपयोग में आसान सेवा है जो आपको बाजार में नवीनतम परिवर्तनों के बारे में जागरूक होने और समय पर बाजार से संकेतों पर प्रतिक्रिया करने की अनुमति देती है। हमारी सेवा में आप हमेशा किसी भी जोड़ी और किसी भी समय सीमा पर नवीनतम और सबसे प्रासंगिक पैटर्न प्राप्त कर सकते हैं.
Double Top
was formed on 22.04 at 20:40:40 (UTC+0)
signal strength 1 of 5
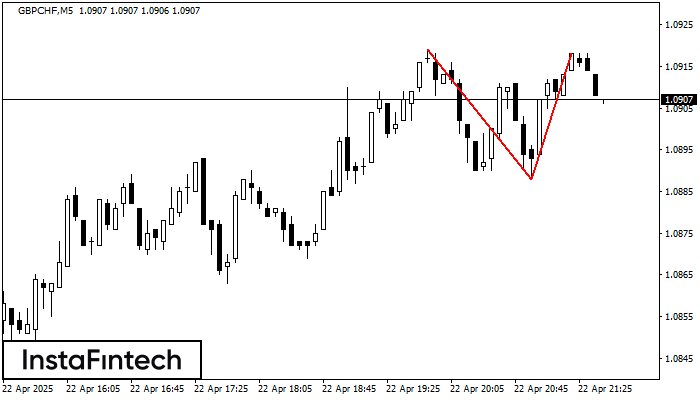
The Double Top pattern has been formed on GBPCHF M5. It signals that the trend has been changed from upwards to downwards. Probably, if the base of the pattern 1.0888 is broken, the downward movement will continue.
The M5 and M15 time frames may have more false entry points.
- All
- All
- Bearish Rectangle
- Bearish Symmetrical Triangle
- Bearish Symmetrical Triangle
- Bullish Rectangle
- Double Top
- Double Top
- Triple Bottom
- Triple Bottom
- Triple Top
- Triple Top
- All
- All
- Buy
- Sale
- All
- 1
- 2
- 3
- 4
- 5
बियरिश सिमेट्रिकल त्रिभुज
was formed on 23.05 at 00:42:21 (UTC+0)
signal strength 2 of 5
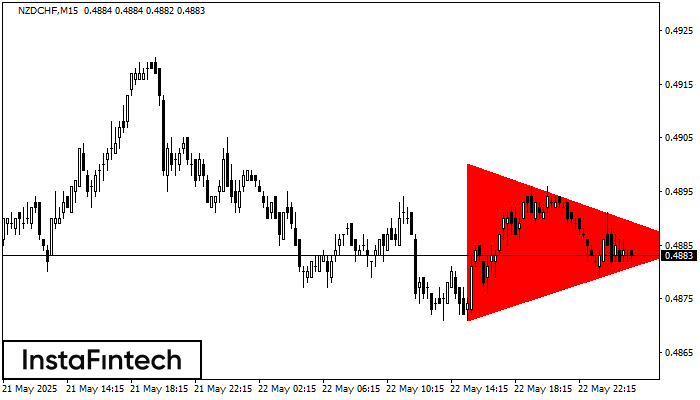
M15 के चार्ट के अनुसार, NZDCHF से बियरिश सिमेट्रिकल त्रिभुज पैटर्न बना। ट्रेडिंग अनुशंसाएं: संभावना है की निचली सीमा 0.4871 का उल्लंघन नीचे की प्रवृत्ति को जारी रखने के लिए
M5 और M15 समय सीमा में अधिक फाल्स एंट्री पॉइंट्स हो सकते हैं।
Open chart in a new window
डबल बॉटम
was formed on 23.05 at 00:40:02 (UTC+0)
signal strength 1 of 5
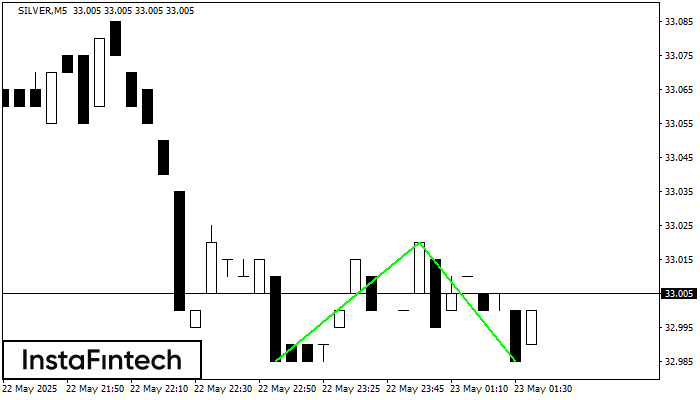
डबल बॉटम पैटर्न SILVER M5 पर बना है। यह फॉर्मेशन नीचे से ऊपर की ओर प्रवृत्ति के उलट होने का संकेत देता है। संकेत यह है कि पैटर्न 33.02 की
M5 और M15 समय सीमा में अधिक फाल्स एंट्री पॉइंट्स हो सकते हैं।
Open chart in a new window
बियरिश सिमेट्रिकल त्रिभुज
was formed on 23.05 at 00:27:26 (UTC+0)
signal strength 1 of 5
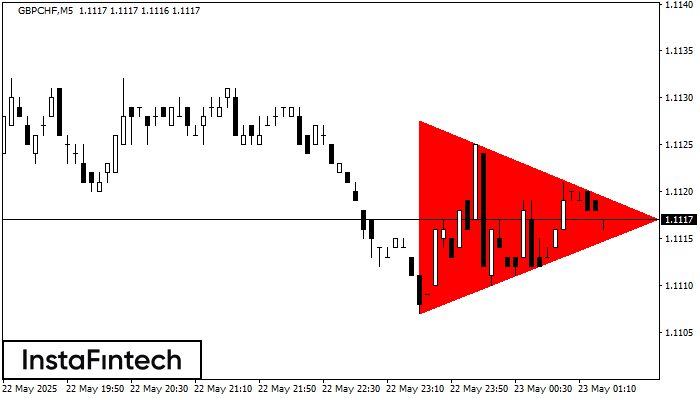
M5 के चार्ट के अनुसार, GBPCHF से बियरिश सिमेट्रिकल त्रिभुज पैटर्न बना। ट्रेडिंग अनुशंसाएं: संभावना है की निचली सीमा 1.1107 का उल्लंघन नीचे की प्रवृत्ति को जारी रखने के लिए
M5 और M15 समय सीमा में अधिक फाल्स एंट्री पॉइंट्स हो सकते हैं।
Open chart in a new window


