

Corak sebenar

Double Bottom
was formed on 31.03 at 02:45:08 (UTC+0)
signal strength 1 of 5
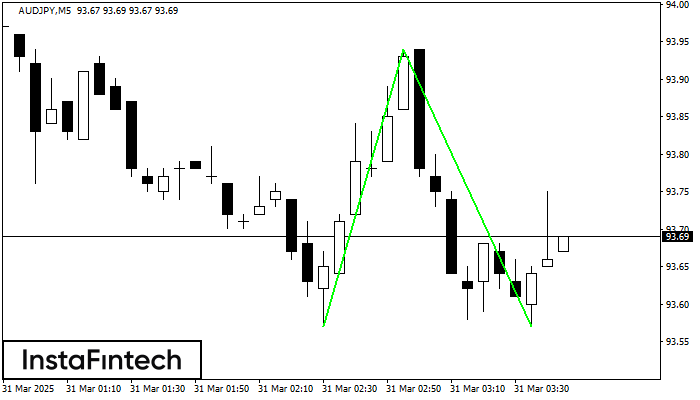
The Double Bottom pattern has been formed on AUDJPY M5. This formation signals a reversal of the trend from downwards to upwards. The signal is that a buy trade should be opened after the upper boundary of the pattern 93.94 is broken. The further movements will rely on the width of the current pattern 37 points.
The M5 and M15 time frames may have more false entry points.
- All
- All
- Bearish Rectangle
- Bearish Symmetrical Triangle
- Bearish Symmetrical Triangle
- Bullish Rectangle
- Double Top
- Double Top
- Triple Bottom
- Triple Bottom
- Triple Top
- Triple Top
- All
- All
- Buy
- Sale
- All
- 1
- 2
- 3
- 4
- 5
Triple Bottom
was formed on 24.04 at 08:30:33 (UTC+0)
signal strength 3 of 5
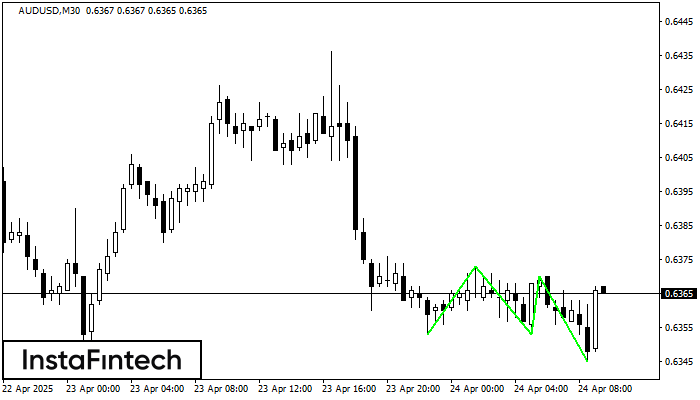
Corak Triple Bottom telah dibentuk pada carta AUDUSD M30. Ciri-ciri corak: Garisan bawah corak mempunyai koordinat 0.6373 dengan had atas 0.6373/0.6370, unjuran lebar adalah 20 mata. Pembentukan corak Triple Bottom
Open chart in a new window
Double Bottom
was formed on 24.04 at 08:30:24 (UTC+0)
signal strength 3 of 5
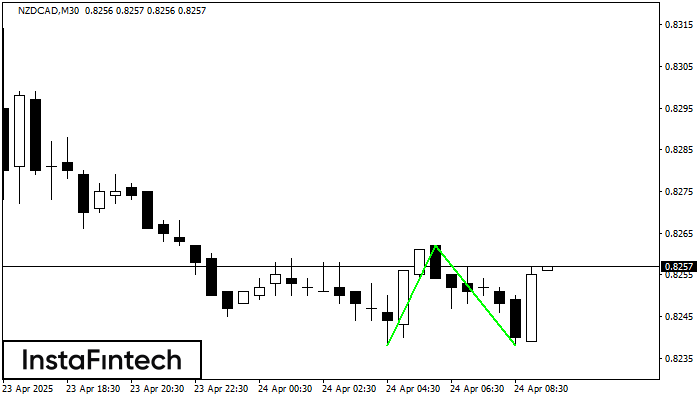
Corak Double Bottom telah dibentuk pada NZDCAD M30. Pembentukan ini menandakan pembalikan aliran dari aliran menurun ke atas. Isyarat ialah perdagangan membeli harus dibuka selepas sempadan atas corak 0.8262 telah
Open chart in a new window
Triple Bottom
was formed on 24.04 at 08:30:23 (UTC+0)
signal strength 2 of 5
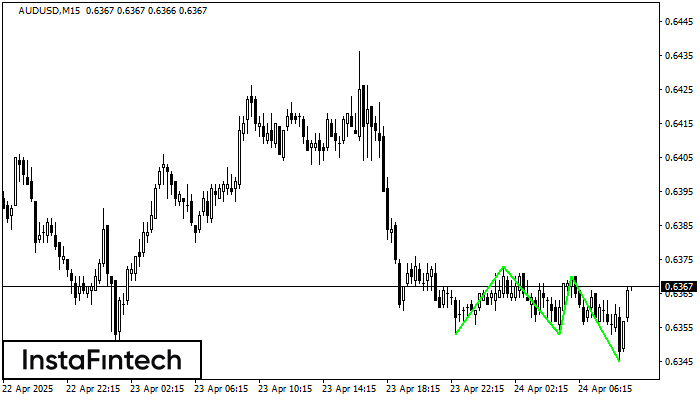
Corak Triple Bottom telah dibentuk pada AUDUSD M15. Ia mempunyai ciri-ciri berikut: tahap rintangan 0.6373/0.6370; tahap sokongan 0.6353/0.6345; lebar corak adalah 20 mata. Dalam situasi penembusan paras rintangan 0.6373, harga
Carta masa M5 dan M15 mungkin mempunyai lebih banyak titik kemasukan palsu.
Open chart in a new window


