

Corak sebenar

Double Bottom
was formed on 24.04 at 08:30:24 (UTC+0)
signal strength 3 of 5
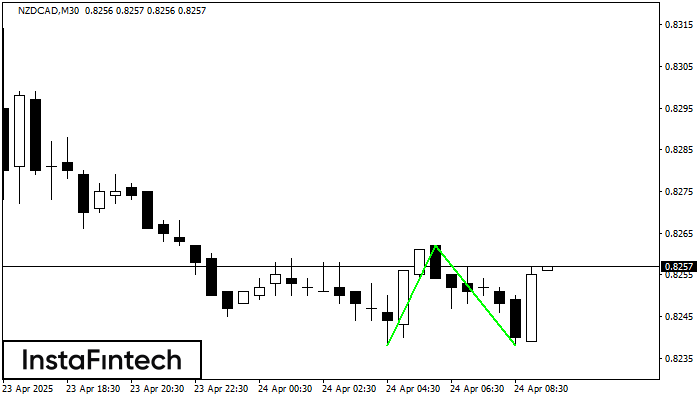
The Double Bottom pattern has been formed on NZDCAD M30. This formation signals a reversal of the trend from downwards to upwards. The signal is that a buy trade should be opened after the upper boundary of the pattern 0.8262 is broken. The further movements will rely on the width of the current pattern 24 points.
Juga lihat
- All
- All
- Bearish Rectangle
- Bearish Symmetrical Triangle
- Bearish Symmetrical Triangle
- Bullish Rectangle
- Double Top
- Double Top
- Triple Bottom
- Triple Bottom
- Triple Top
- Triple Top
- All
- All
- Buy
- Sale
- All
- 1
- 2
- 3
- 4
- 5
Segi Empat Menaik
was formed on 11.08 at 04:01:16 (UTC+0)
signal strength 3 of 5
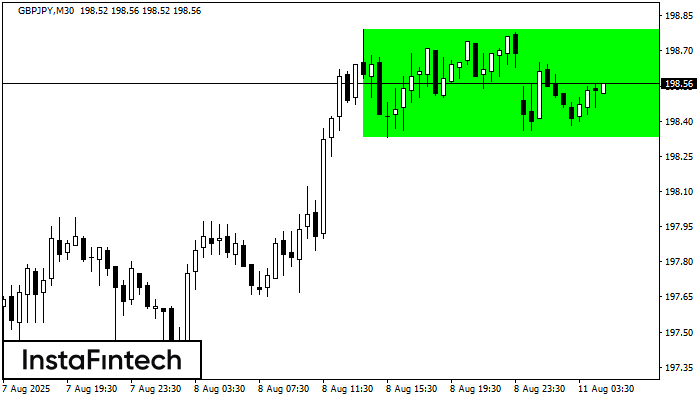
Berdasarkan carta M30, GBPJPY telah membentuk Segi Empat Menaik. Corak ini menunjukkan kesinambungan aliran. Sempadan atas adalah 198.79, sempadan bawah adalah 198.33. Isyarat bermakna bahawa kedudukan panjang perlu dibuka
Open chart in a new window
Double Bottom
was formed on 11.08 at 03:00:24 (UTC+0)
signal strength 1 of 5
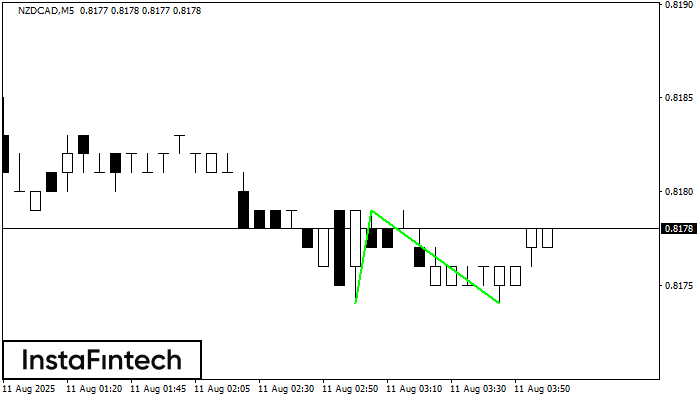
Corak Double Bottom telah dibentuk pada NZDCAD M5. Pembentukan ini menandakan pembalikan aliran dari aliran menurun ke atas. Isyarat ialah perdagangan membeli harus dibuka selepas sempadan atas corak 0.8179 telah
Carta masa M5 dan M15 mungkin mempunyai lebih banyak titik kemasukan palsu.
Open chart in a new window
Double Top
was formed on 11.08 at 00:00:17 (UTC+0)
signal strength 4 of 5
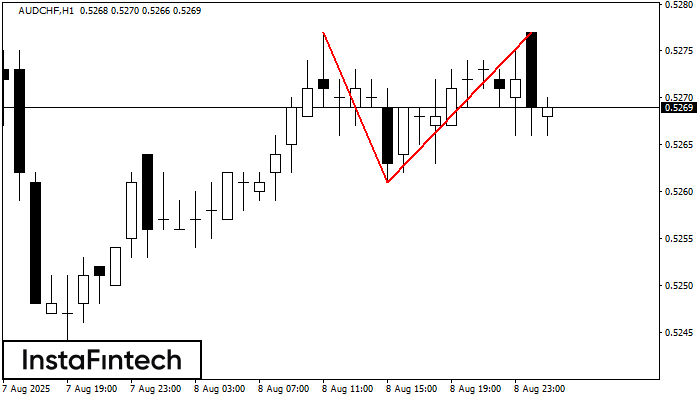
Corak pembalikan Double Top telah dibentuk pada AUDCHF H1. Ciri-ciri: sempadan atas %P0.000000; sempadan bawah 0.5277; sempadan bawah 0.5261; lebar corak adalah 16 mata. Dagangan menjual adalah lebih baik untuk
Open chart in a new window


