

Corak sebenar

Triple Bottom
was formed on 31.03 at 01:40:32 (UTC+0)
signal strength 1 of 5
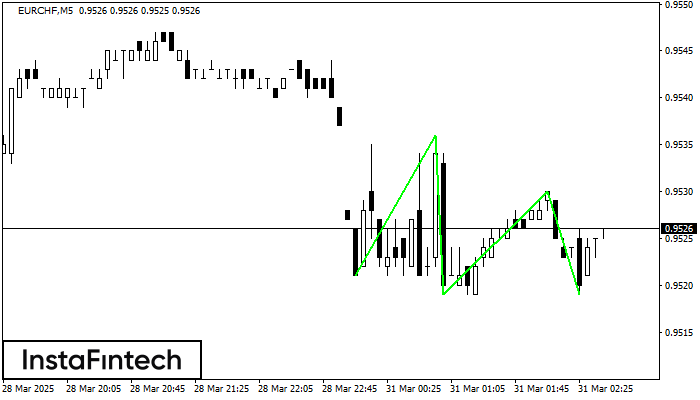
The Triple Bottom pattern has formed on the chart of EURCHF M5. Features of the pattern: The lower line of the pattern has coordinates 0.9536 with the upper limit 0.9536/0.9530, the projection of the width is 15 points. The formation of the Triple Bottom pattern most likely indicates a change in the trend from downward to upward. This means that in the event of a breakdown of the resistance level 0.9521, the price is most likely to continue the upward movement.
The M5 and M15 time frames may have more false entry points.
- All
- All
- Bearish Rectangle
- Bearish Symmetrical Triangle
- Bearish Symmetrical Triangle
- Bullish Rectangle
- Double Top
- Double Top
- Triple Bottom
- Triple Bottom
- Triple Top
- Triple Top
- All
- All
- Buy
- Sale
- All
- 1
- 2
- 3
- 4
- 5
Teratas Ganda
was formed on 24.04 at 11:40:32 (UTC+0)
signal strength 1 of 5
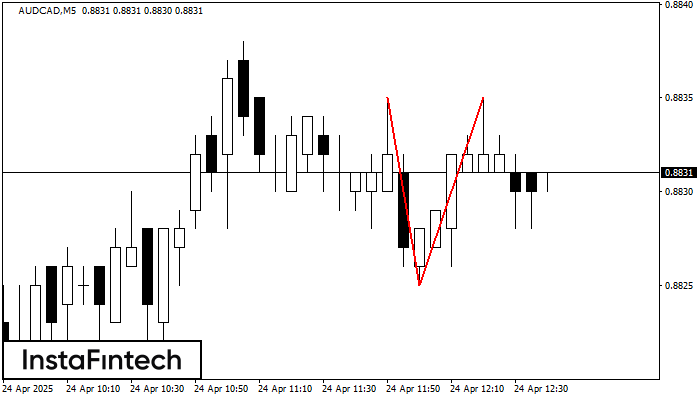
Pada grafik AUDCAD M5 pola reversal Teratas Ganda telah terbentuk. Karakteristik: batas atas 0.8835; batas bawah 0.8825; lebar pola 10 poin. Sinyal: tembusan ke batas bawah akan menyebabkan kelanjutan tren
Rangka waktu M5 dan M15 mungkin memiliki lebih dari titik entri yang keliru.
Open chart in a new window
Teratas Ganda
was formed on 24.04 at 11:35:08 (UTC+0)
signal strength 1 of 5
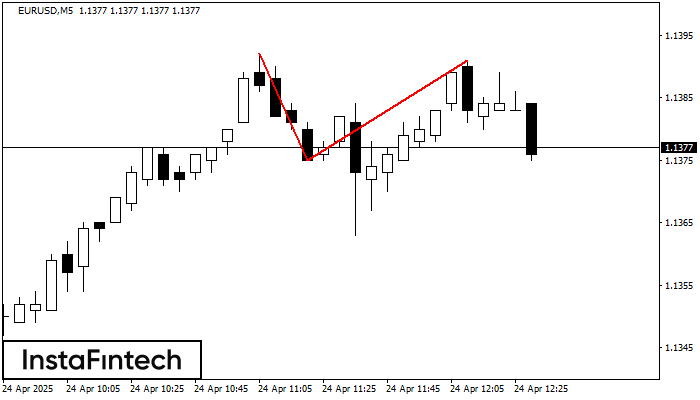
Pola reversal Teratas Ganda telah terbentuk pada EURUSD M5. Karakteristik: batas atas 1.1392; batas bawah 1.1375; lebar pola 16 poin. Transaksi jual lebih baik dibuka di bawah batas bawah 1.1375
Rangka waktu M5 dan M15 mungkin memiliki lebih dari titik entri yang keliru.
Open chart in a new window
Bawah Ganda
was formed on 24.04 at 11:30:18 (UTC+0)
signal strength 1 of 5
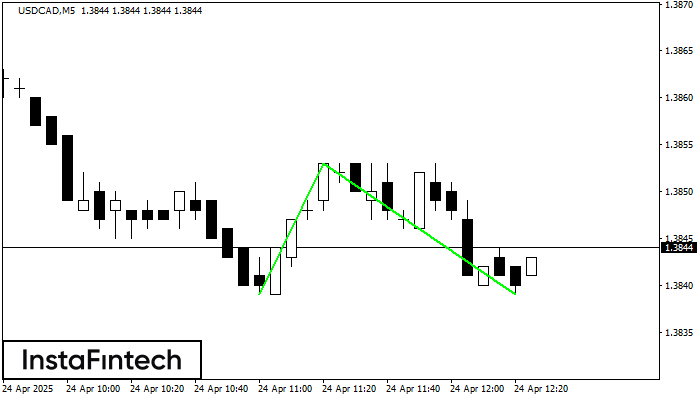
Pola Bawah Ganda telah terbentuk pada USDCAD M5; batas atas di 1.3853; batas bawah di 1.3839. Lebar pola sebesar 14 poin. Jika harga menembus batas atas 1.3853, Perubahan dalam tren
Rangka waktu M5 dan M15 mungkin memiliki lebih dari titik entri yang keliru.
Open chart in a new window


