

Pola sebenarnya

Double Bottom
was formed on 24.04 at 11:30:18 (UTC+0)
signal strength 1 of 5
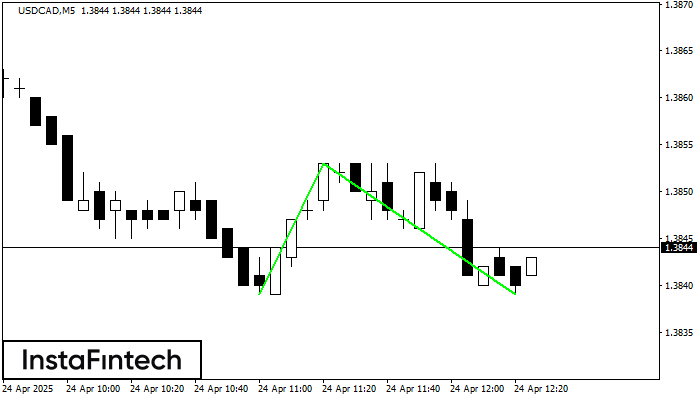
The Double Bottom pattern has been formed on USDCAD M5; the upper boundary is 1.3853; the lower boundary is 1.3839. The width of the pattern is 14 points. In case of a break of the upper boundary 1.3853, a change in the trend can be predicted where the width of the pattern will coincide with the distance to a possible take profit level.
The M5 and M15 time frames may have more false entry points.
Lihat juga
- All
- All
- Bearish Rectangle
- Bearish Symmetrical Triangle
- Bearish Symmetrical Triangle
- Bullish Rectangle
- Double Top
- Double Top
- Triple Bottom
- Triple Bottom
- Triple Top
- Triple Top
- All
- All
- Buy
- Sale
- All
- 1
- 2
- 3
- 4
- 5
বিয়ারিশ রেক্ট্যাঙ্গেল
was formed on 30.05 at 13:12:54 (UTC+0)
signal strength 1 of 5
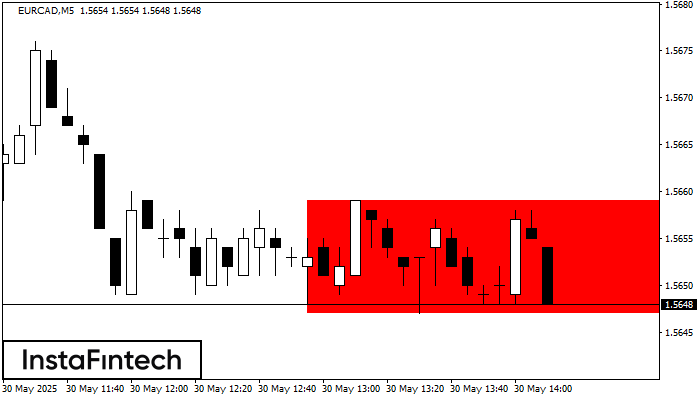
M5 চার্ট অনুযায়ী, EURCAD বিয়ারিশ রেক্ট্যাঙ্গেল গঠন করেছে। এই প্যাটার্ন চলমান প্রবণতার ধারাবাহিকতা নির্দেশ করে। উপরের সীমানা হল 1.5659, নীচের সীমানা হল 1.5647৷ এই সংকেতের অর্থ হল বিয়ারিশ রেক্ট্যাঙ্গেল-এর নীচের
M5 এবং M15 টাইম ফ্রেমে আরও ভুল এন্ট্রি পয়েন্ট থাকতে পারে।
Open chart in a new window
ডাবল বটম
was formed on 30.05 at 12:31:28 (UTC+0)
signal strength 3 of 5
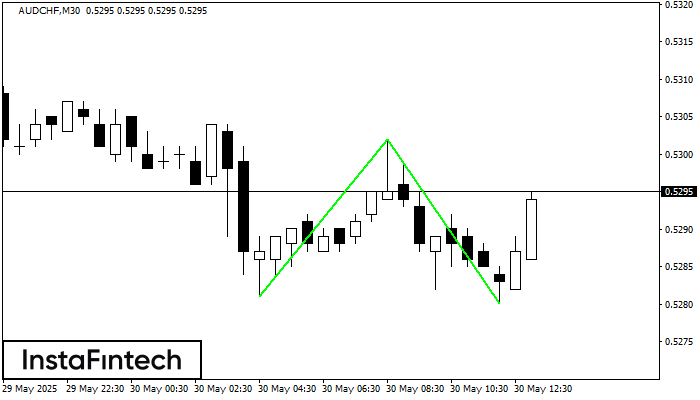
M30 চার্টে, AUDCHF-এর ডাবল বটম প্যাটার্নটি গঠিত হয়েছে। বৈশিষ্ট্য: সাপোর্ট স্তর হচ্ছে 0.5281; রেজিস্ট্যান্স স্তর হচ্ছে 0.5302; প্যাটার্নের প্রস্থ হচ্ছে 21 পয়েন্ট। রেজিস্ট্যান্স স্তর ভেদ করা হলে, 22 পয়েন্টের দূরত্বে
Open chart in a new window
ডাবল বটম
was formed on 30.05 at 12:00:29 (UTC+0)
signal strength 2 of 5
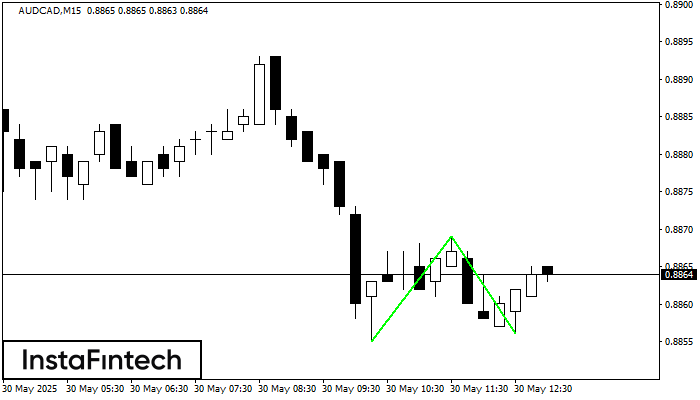
M15 চার্টে, AUDCAD-এর ডাবল বটম প্যাটার্নটি গঠিত হয়েছে। উপরের সীমানা হল 0.8869; নীচের সীমানা হল 0.8856। প্যাটার্নের প্রস্থ হল 14 পয়েন্ট। 0.8869-এর উপরের সীমানা ভেদ করার ক্ষেত্রে, প্রবণতা পরিবর্তনের পূর্বাভাস
M5 এবং M15 টাইম ফ্রেমে আরও ভুল এন্ট্রি পয়েন্ট থাকতে পারে।
Open chart in a new window


