

Pola sebenarnya

Bullish Symmetrical Triangle
was formed on 14.04 at 02:51:59 (UTC+0)
signal strength 1 of 5

According to the chart of M5, GBPAUD formed the Bullish Symmetrical Triangle pattern. The lower border of the pattern touches the coordinates 2.0704/2.0775 whereas the upper border goes across 2.0831/2.0775. If the Bullish Symmetrical Triangle pattern is in progress, this evidently signals a further upward trend. In other words, in case the scenario comes true, the price of GBPAUD will breach the upper border to head for 2.0790.
The M5 and M15 time frames may have more false entry points.
- All
- All
- Bearish Rectangle
- Bearish Symmetrical Triangle
- Bearish Symmetrical Triangle
- Bullish Rectangle
- Double Top
- Double Top
- Triple Bottom
- Triple Bottom
- Triple Top
- Triple Top
- All
- All
- Buy
- Sale
- All
- 1
- 2
- 3
- 4
- 5
Segitiga Simetris Bullish
was formed on 23.04 at 11:41:41 (UTC+0)
signal strength 2 of 5

Menurut Grafik dari M15, NZDJPY dibentuk pola Segitiga Simetris Bullish. Deskripsi: Ini merupakan pola dari kelanjutan tren. 85.15 dan 84.50 adalah kordinat masing-masing dari batas atas dan lebih rendah. Lebar
Rangka waktu M5 dan M15 mungkin memiliki lebih dari titik entri yang keliru.
Open chart in a new window
Teratas Ganda
was formed on 23.04 at 11:40:40 (UTC+0)
signal strength 1 of 5
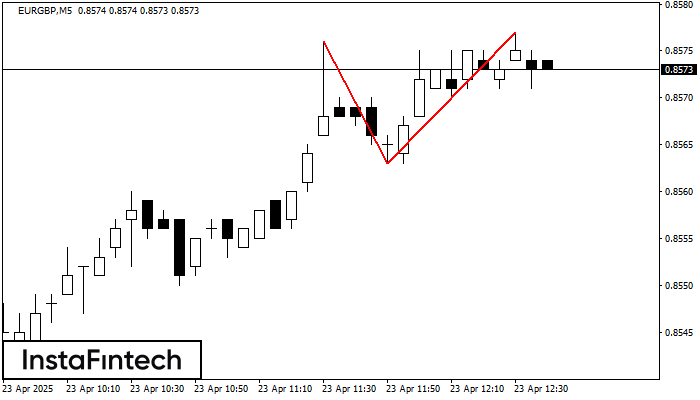
Pada grafik EURGBP M5 pola reversal Teratas Ganda telah terbentuk. Karakteristik: batas atas 0.8577; batas bawah 0.8563; lebar pola 14 poin. Sinyal: tembusan ke batas bawah akan menyebabkan kelanjutan tren
Rangka waktu M5 dan M15 mungkin memiliki lebih dari titik entri yang keliru.
Open chart in a new window
Teratas Ganda
was formed on 23.04 at 11:40:18 (UTC+0)
signal strength 1 of 5

Pada grafik EURNZD M5 pola reversal Teratas Ganda telah terbentuk. Karakteristik: batas atas 1.9084; batas bawah 1.9056; lebar pola 28 poin. Sinyal: tembusan ke batas bawah akan menyebabkan kelanjutan tren
Rangka waktu M5 dan M15 mungkin memiliki lebih dari titik entri yang keliru.
Open chart in a new window


