

Pola sebenarnya

Bullish Symmetrical Triangle
was formed on 23.04 at 11:41:41 (UTC+0)
signal strength 2 of 5

According to the chart of M15, NZDJPY formed the Bullish Symmetrical Triangle pattern. Description: This is the pattern of a trend continuation. 85.15 and 84.50 are the coordinates of the upper and lower borders respectively. The pattern width is measured on the chart at 65 pips. Outlook: If the upper border 85.15 is broken, the price is likely to continue its move by 85.10.
The M5 and M15 time frames may have more false entry points.
- All
- All
- Bearish Rectangle
- Bearish Symmetrical Triangle
- Bearish Symmetrical Triangle
- Bullish Rectangle
- Double Top
- Double Top
- Triple Bottom
- Triple Bottom
- Triple Top
- Triple Top
- All
- All
- Buy
- Sale
- All
- 1
- 2
- 3
- 4
- 5
Двойное дно
сформирован 23.05 в 16:44:58 (UTC+0)
сила сигнала 1 из 5
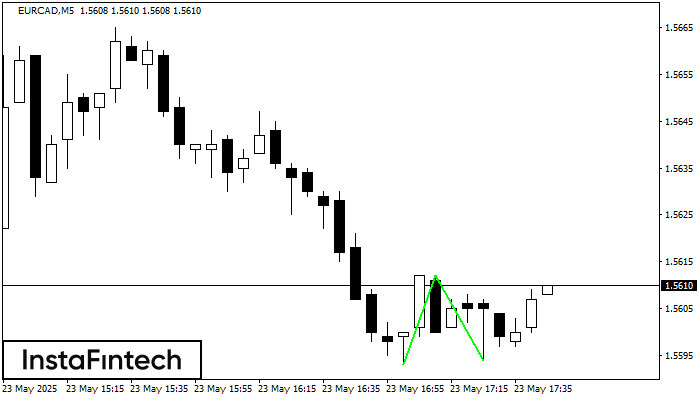
Сформирована фигура «Двойное дно» на графике EURCAD M5. Верхняя граница 1.5612; Нижняя граница 1.5594; Ширина фигуры 19 пунктов. В случае пробоя верхней границы 1.5612 можно будет прогнозировать изменение тенденции
Таймфреймы М5 и М15 могут иметь больше ложных точек входа.
Открыть график инструмента в новом окне
Медвежий вымпел
сформирован 23.05 в 15:46:06 (UTC+0)
сила сигнала 1 из 5
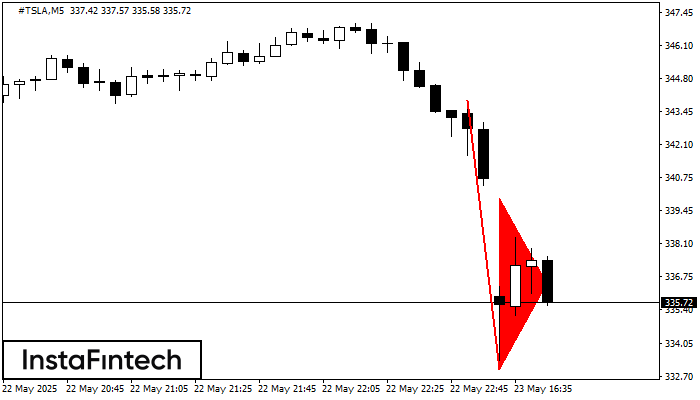
На графике #TSLA M5 сформировалась фигура «Медвежий вымпел», которая сигнализирует о возможном продолжении тренда. Характеристика: основание фигуры имеет координаты 332.99; проекция высоты флагштока равна 1089 пунктов. В случае если цена
Таймфреймы М5 и М15 могут иметь больше ложных точек входа.
Открыть график инструмента в новом окне
Медвежий вымпел
сформирован 23.05 в 15:45:52 (UTC+0)
сила сигнала 1 из 5

На графике #TSLA M5 сформировалась фигура «Медвежий вымпел». Фигура сигнализирует о продолжении нисходящего тренда в случае пробоя минимума вымпела 332.99. Рекомендации: Отложенный ордер Sell Stop выставляется на 10 пунктов ниже
Таймфреймы М5 и М15 могут иметь больше ложных точек входа.
Открыть график инструмента в новом окне


