

Pola sebenarnya

Bearish Symmetrical Triangle
was formed on 07.04 at 20:55:03 (UTC+0)
signal strength 2 of 5

According to the chart of M15, #MA formed the Bearish Symmetrical Triangle pattern. Description: The lower border is 466.76/487.62 and upper border is 503.68/487.62. The pattern width is measured on the chart at -3692 pips. The formation of the Bearish Symmetrical Triangle pattern evidently signals a continuation of the downward trend. In other words, if the scenario comes true and #MA breaches the lower border, the price could continue its move toward 487.39.
The M5 and M15 time frames may have more false entry points.
- All
- All
- Bearish Rectangle
- Bearish Symmetrical Triangle
- Bearish Symmetrical Triangle
- Bullish Rectangle
- Double Top
- Double Top
- Triple Bottom
- Triple Bottom
- Triple Top
- Triple Top
- All
- All
- Buy
- Sale
- All
- 1
- 2
- 3
- 4
- 5
Persegi Bullish
was formed on 22.04 at 17:40:16 (UTC+0)
signal strength 1 of 5
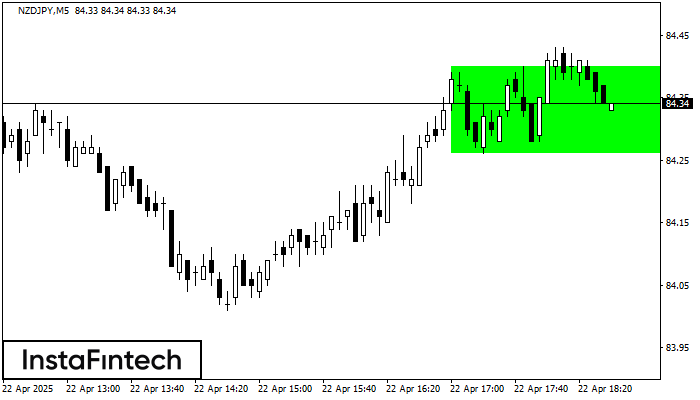
Menurut grafik dari M5, NZDJPY terbentuk Persegi Bullish. Jenis pola ini menunjukkan kelanjutan tren. Terdiri dari dua tingkat: resistance 84.40 dan support 84.26. Jika level resistance 84.40 - 84.40 ditembus
Rangka waktu M5 dan M15 mungkin memiliki lebih dari titik entri yang keliru.
Open chart in a new window
Segitiga Simetris Bearish
was formed on 22.04 at 17:31:26 (UTC+0)
signal strength 1 of 5
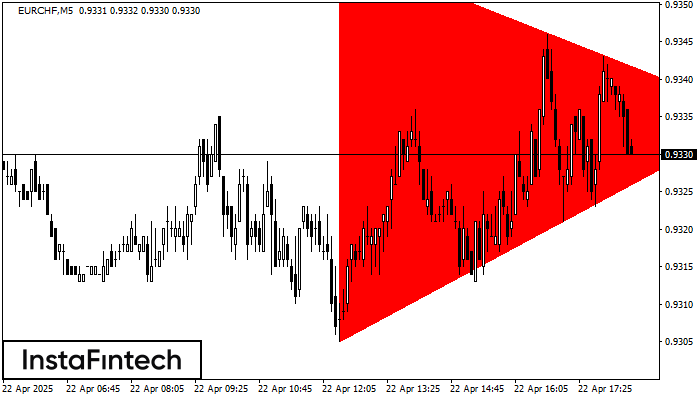
Menurut Grafik dari M5, EURCHF dibentuk pola Segitiga Simetris Bearish. Rekomendasi Trading: Penembusan dari batas yang lebih rendah 0.9305 kemungkinan akan mendorong kelanjutan dari tren penurunan
Rangka waktu M5 dan M15 mungkin memiliki lebih dari titik entri yang keliru.
Open chart in a new window
Segitiga Simetris Bearish
was formed on 22.04 at 17:30:13 (UTC+0)
signal strength 1 of 5
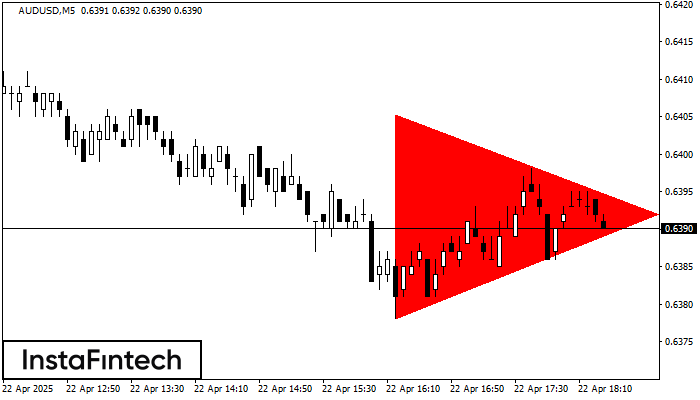
Menurut Grafik dari M5, AUDUSD dibentuk pola Segitiga Simetris Bearish. Deskripsi: Batas yang lebih rendah adalah 0.6378/0.6392 dan batas atas adalah 0.6405/0.6392. Lebar pola diukur dalam grafik di -27 pips
Rangka waktu M5 dan M15 mungkin memiliki lebih dari titik entri yang keliru.
Open chart in a new window

