

Pola sebenarnya

Bullish Rectangle
was formed on 22.04 at 17:40:16 (UTC+0)
signal strength 1 of 5
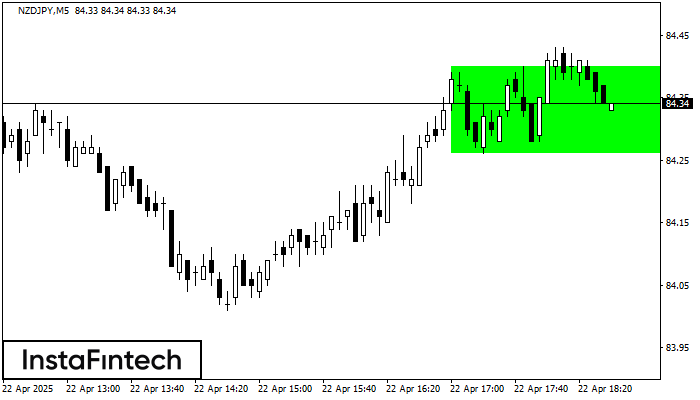
According to the chart of M5, NZDJPY formed the Bullish Rectangle. This type of a pattern indicates a trend continuation. It consists of two levels: resistance 84.40 and support 84.26. In case the resistance level 84.40 - 84.40 is broken, the instrument is likely to follow the bullish trend.
The M5 and M15 time frames may have more false entry points.
- All
- All
- Bearish Rectangle
- Bearish Symmetrical Triangle
- Bearish Symmetrical Triangle
- Bullish Rectangle
- Double Top
- Double Top
- Triple Bottom
- Triple Bottom
- Triple Top
- Triple Top
- All
- All
- Buy
- Sale
- All
- 1
- 2
- 3
- 4
- 5
Persegi Bearish
was formed on 23.05 at 23:00:20 (UTC+0)
signal strength 1 of 5

Menurut grafik dari M5, EURNZD terbentuk Persegi Bearish. Pola menunjukkan kelanjutan tren. Batas atas adalah 1.8982, batas rendah adalah 1.8964. Sinyal berarti posisi jual harus dibuka setelah menetapkan harga dibawah
Rangka waktu M5 dan M15 mungkin memiliki lebih dari titik entri yang keliru.
Open chart in a new window
Segitiga Simetris Bullish
was formed on 23.05 at 22:14:53 (UTC+0)
signal strength 1 of 5

Menurut Grafik dari M5, AUDCHF dibentuk pola Segitiga Simetris Bullish. Deskripsi: Ini merupakan pola dari kelanjutan tren. 0.5335 dan 0.5329 adalah kordinat masing-masing dari batas atas dan lebih rendah. Lebar
Rangka waktu M5 dan M15 mungkin memiliki lebih dari titik entri yang keliru.
Open chart in a new window
Segitiga Simetris Bullish
was formed on 23.05 at 22:10:58 (UTC+0)
signal strength 1 of 5

Menurut Grafik dari M5, AUDJPY dibentuk pola Segitiga Simetris Bullish. Deskripsi: Ini merupakan pola dari kelanjutan tren. 92.60 dan 92.44 adalah kordinat masing-masing dari batas atas dan lebih rendah. Lebar
Rangka waktu M5 dan M15 mungkin memiliki lebih dari titik entri yang keliru.
Open chart in a new window


