

Pola sebenarnya

Triple Top
was formed on 07.04 at 12:10:10 (UTC+0)
signal strength 1 of 5
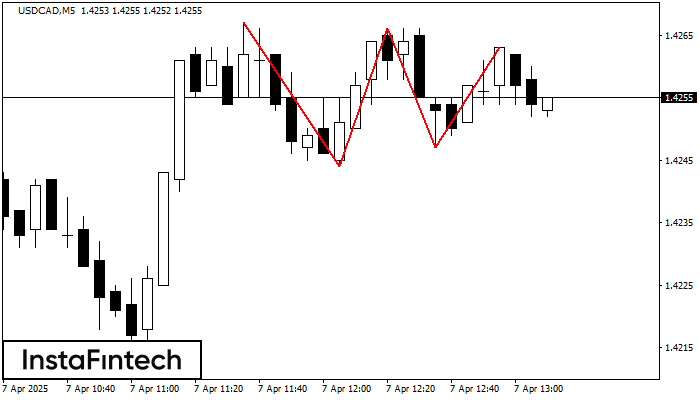
On the chart of the USDCAD M5 trading instrument, the Triple Top pattern that signals a trend change has formed. It is possible that after formation of the third peak, the price will try to break through the resistance level 1.4244, where we advise to open a trading position for sale. Take profit is the projection of the pattern’s width, which is 23 points.
The M5 and M15 time frames may have more false entry points.
Lihat juga
- All
- All
- Bearish Rectangle
- Bearish Symmetrical Triangle
- Bearish Symmetrical Triangle
- Bullish Rectangle
- Double Top
- Double Top
- Triple Bottom
- Triple Bottom
- Triple Top
- Triple Top
- All
- All
- Buy
- Sale
- All
- 1
- 2
- 3
- 4
- 5
Persegi Bearish
was formed on 17.04 at 05:27:54 (UTC+0)
signal strength 1 of 5

Menurut grafik dari M5, AUDUSD terbentuk Persegi Bearish yang merupakan pola dari kelanjutan tren. Pola terkandung di dalam batas berikut: batas lebih rendah 0.6353 – 0.6353 dan batas atas 0.6366
Rangka waktu M5 dan M15 mungkin memiliki lebih dari titik entri yang keliru.
Open chart in a new window
Persegi Bullish
was formed on 17.04 at 05:00:58 (UTC+0)
signal strength 3 of 5

Menurut grafik dari M30, EURGBP terbentuk Persegi Bullish. Jenis pola ini menunjukkan kelanjutan tren. Terdiri dari dua tingkat: resistance 0.8615 dan support 0.8598. Jika level resistance 0.8615 - 0.8615 ditembus
Open chart in a new window
Bawah Ganda
was formed on 17.04 at 04:15:46 (UTC+0)
signal strength 2 of 5

Pola Bawah Ganda telah terbentuk pada EURCAD M15. Karakteristik: level support 1.5761; level resistance 1.5828; lebar pola 67 poin. Jika level resistance ditembus, perubahan dalam tren dapat diprediksi dengan target
Rangka waktu M5 dan M15 mungkin memiliki lebih dari titik entri yang keliru.
Open chart in a new window


