

Pola sebenarnya

Bearish Rectangle
was formed on 17.04 at 05:27:54 (UTC+0)
signal strength 1 of 5

According to the chart of M5, AUDUSD formed the Bearish Rectangle which is a pattern of a trend continuation. The pattern is contained within the following borders: lower border 0.6353 – 0.6353 and upper border 0.6366 – 0.6366. In case the lower border is broken, the instrument is likely to follow the downward trend.
The M5 and M15 time frames may have more false entry points.
Lihat juga
- All
- All
- Bearish Rectangle
- Bearish Symmetrical Triangle
- Bearish Symmetrical Triangle
- Bullish Rectangle
- Double Top
- Double Top
- Triple Bottom
- Triple Bottom
- Triple Top
- Triple Top
- All
- All
- Buy
- Sale
- All
- 1
- 2
- 3
- 4
- 5
Double Bottom
was formed on 30.05 at 19:05:16 (UTC+0)
signal strength 1 of 5
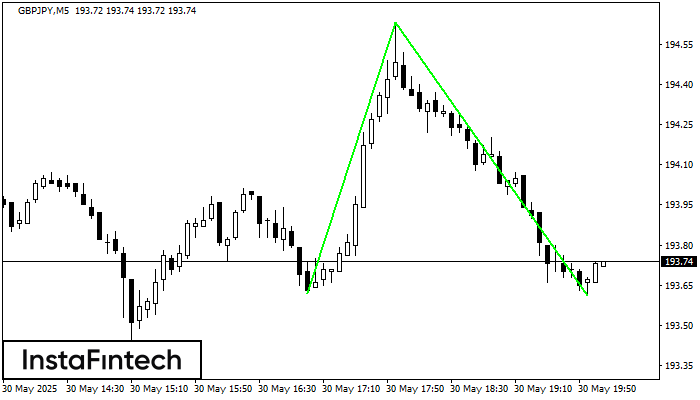
The Double Bottom pattern has been formed on GBPJPY M5; the upper boundary is 194.63; the lower boundary is 193.61. The width of the pattern is 101 points. In case
The M5 and M15 time frames may have more false entry points.
Open chart in a new window
Double Top
was formed on 30.05 at 18:30:13 (UTC+0)
signal strength 2 of 5
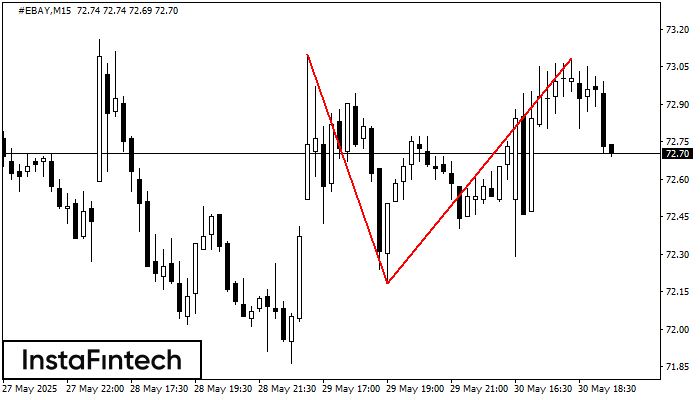
The Double Top reversal pattern has been formed on #EBAY M15. Characteristics: the upper boundary 73.10; the lower boundary 72.18; the width of the pattern is 90 points. Sell trades
The M5 and M15 time frames may have more false entry points.
Open chart in a new window
Bullish Rectangle
was formed on 30.05 at 18:25:46 (UTC+0)
signal strength 1 of 5
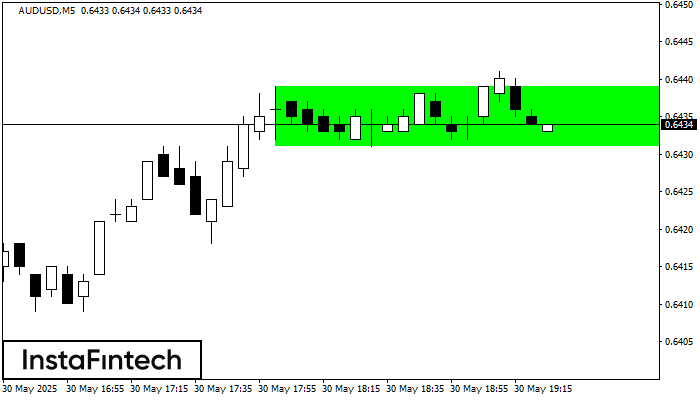
According to the chart of M5, AUDUSD formed the Bullish Rectangle. This type of a pattern indicates a trend continuation. It consists of two levels: resistance 0.6439 and support 0.6431
The M5 and M15 time frames may have more false entry points.
Open chart in a new window


