

Pola sebenarnya

Bullish Symmetrical Triangle
was formed on 07.04 at 04:20:08 (UTC+0)
signal strength 2 of 5
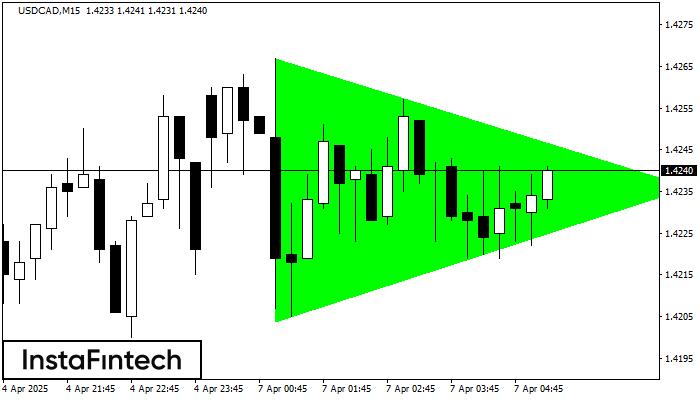
According to the chart of M15, USDCAD formed the Bullish Symmetrical Triangle pattern. Description: This is the pattern of a trend continuation. 1.4267 and 1.4204 are the coordinates of the upper and lower borders respectively. The pattern width is measured on the chart at 63 pips. Outlook: If the upper border 1.4267 is broken, the price is likely to continue its move by 1.4259.
The M5 and M15 time frames may have more false entry points.
- All
- All
- Bearish Rectangle
- Bearish Symmetrical Triangle
- Bearish Symmetrical Triangle
- Bullish Rectangle
- Double Top
- Double Top
- Triple Bottom
- Triple Bottom
- Triple Top
- Triple Top
- All
- All
- Buy
- Sale
- All
- 1
- 2
- 3
- 4
- 5
Persegi Bearish
was formed on 17.04 at 05:27:54 (UTC+0)
signal strength 1 of 5

Menurut grafik dari M5, AUDUSD terbentuk Persegi Bearish yang merupakan pola dari kelanjutan tren. Pola terkandung di dalam batas berikut: batas lebih rendah 0.6353 – 0.6353 dan batas atas 0.6366
Rangka waktu M5 dan M15 mungkin memiliki lebih dari titik entri yang keliru.
Open chart in a new window
Persegi Bullish
was formed on 17.04 at 05:00:58 (UTC+0)
signal strength 3 of 5

Menurut grafik dari M30, EURGBP terbentuk Persegi Bullish. Jenis pola ini menunjukkan kelanjutan tren. Terdiri dari dua tingkat: resistance 0.8615 dan support 0.8598. Jika level resistance 0.8615 - 0.8615 ditembus
Open chart in a new window
Bawah Ganda
was formed on 17.04 at 04:15:46 (UTC+0)
signal strength 2 of 5

Pola Bawah Ganda telah terbentuk pada EURCAD M15. Karakteristik: level support 1.5761; level resistance 1.5828; lebar pola 67 poin. Jika level resistance ditembus, perubahan dalam tren dapat diprediksi dengan target
Rangka waktu M5 dan M15 mungkin memiliki lebih dari titik entri yang keliru.
Open chart in a new window


