

Pola sebenarnya

Bearish Symmetrical Triangle
was formed on 04.04 at 03:30:52 (UTC+0)
signal strength 1 of 5
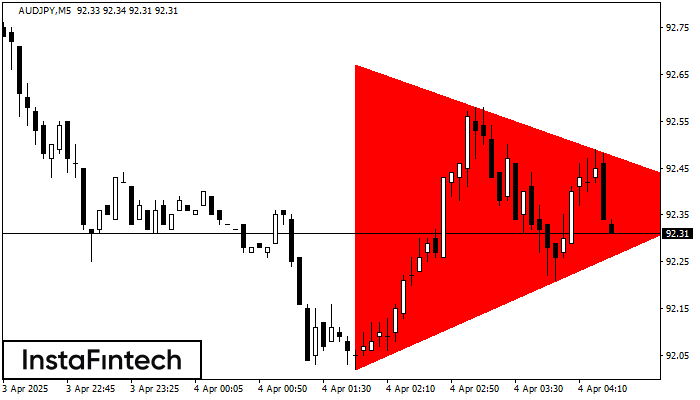
According to the chart of M5, AUDJPY formed the Bearish Symmetrical Triangle pattern. Description: The lower border is 92.02/92.38 and upper border is 92.67/92.38. The pattern width is measured on the chart at -65 pips. The formation of the Bearish Symmetrical Triangle pattern evidently signals a continuation of the downward trend. In other words, if the scenario comes true and AUDJPY breaches the lower border, the price could continue its move toward 92.23.
The M5 and M15 time frames may have more false entry points.
Lihat juga
- All
- All
- Bearish Rectangle
- Bearish Symmetrical Triangle
- Bearish Symmetrical Triangle
- Bullish Rectangle
- Double Top
- Double Top
- Triple Bottom
- Triple Bottom
- Triple Top
- Triple Top
- All
- All
- Buy
- Sale
- All
- 1
- 2
- 3
- 4
- 5
Bendera Bullish
was formed on 17.04 at 13:38:24 (UTC+0)
signal strength 1 of 5
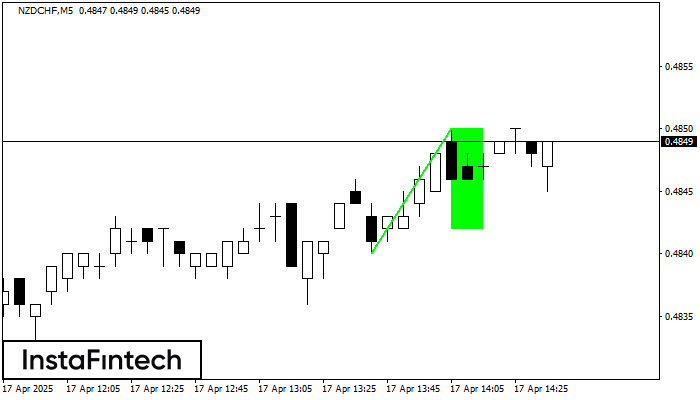
Pola Bendera Bullish telah terbentuk di grafik NZDCHF M5, yang memberikan sinyal tren naik akan berlanjut. Sinyal: penembusan titik puncak di 0.4850 mungkin mendorong harga lebih tinggi, dan kenaikan akan
Rangka waktu M5 dan M15 mungkin memiliki lebih dari titik entri yang keliru.
Open chart in a new window
Bawah Triple
was formed on 17.04 at 13:35:08 (UTC+0)
signal strength 1 of 5
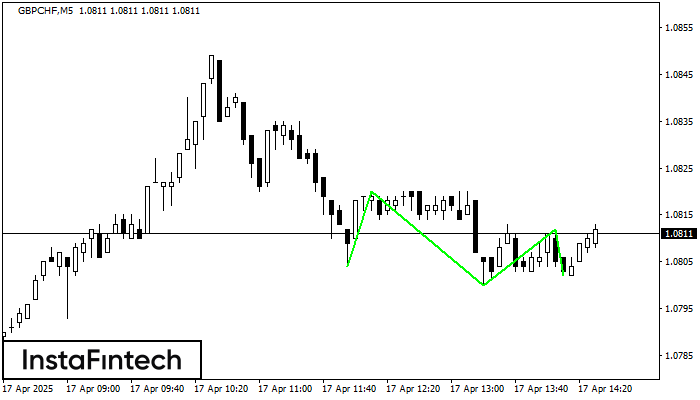
Pola Bawah Triple telah terbentuk pada grafik GBPCHF M5. Fitur-fitur pola: garis bawah pola memiliki koordinat 1.0820 dengan batas atas 1.0820/1.0812, proyeksi lebar adalah 16 poin. Pembentukan pola Bawah Triple
Rangka waktu M5 dan M15 mungkin memiliki lebih dari titik entri yang keliru.
Open chart in a new window
Teratas Ganda
was formed on 17.04 at 12:14:50 (UTC+0)
signal strength 1 of 5

Pola Teratas Ganda telah terbentuk pada GBPUSD M5. Pola ini menandakan bahwa tren telah berubah dari kenaikan menjadi penurunan. Mungkin, jika dasar pola di 1.3238 ditembus, maka pergerakan menurun akan
Rangka waktu M5 dan M15 mungkin memiliki lebih dari titik entri yang keliru.
Open chart in a new window


