

Pola sebenarnya

Triple Bottom
was formed on 17.04 at 13:35:08 (UTC+0)
signal strength 1 of 5
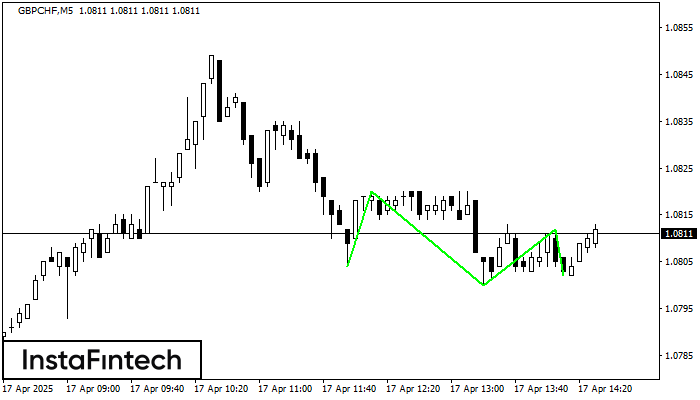
The Triple Bottom pattern has formed on the chart of GBPCHF M5. Features of the pattern: The lower line of the pattern has coordinates 1.0820 with the upper limit 1.0820/1.0812, the projection of the width is 16 points. The formation of the Triple Bottom pattern most likely indicates a change in the trend from downward to upward. This means that in the event of a breakdown of the resistance level 1.0804, the price is most likely to continue the upward movement.
The M5 and M15 time frames may have more false entry points.
- All
- All
- Bearish Rectangle
- Bearish Symmetrical Triangle
- Bearish Symmetrical Triangle
- Bullish Rectangle
- Double Top
- Double Top
- Triple Bottom
- Triple Bottom
- Triple Top
- Triple Top
- All
- All
- Buy
- Sale
- All
- 1
- 2
- 3
- 4
- 5
ট্রিপল টপ
was formed on 30.05 at 22:20:23 (UTC+0)
signal strength 1 of 5

M5 চার্টে, GOLD ট্রেডিং ইন্সট্রুমেন্টের ট্রিপল টপ প্যাটার্ন গঠিত হয়েছে। এটি একটি রিভার্সাল বা বিপরীতমুখী প্যাটার্ন যা নিম্নলিখিত বৈশিষ্ট্যগুলিকে সমন্বিত করে: রেজিস্ট্যান্স স্তর 4, সাপোর্ট স্তর -193 এবং প্যাটার্নের প্রস্থ
M5 এবং M15 টাইম ফ্রেমে আরও ভুল এন্ট্রি পয়েন্ট থাকতে পারে।
Open chart in a new window
ইনভার্স হেড অ্যান্ড শোল্ডার্স
was formed on 30.05 at 21:50:24 (UTC+0)
signal strength 1 of 5

M5 চার্ট অনুযায়ী, #AMZN-এর ইনভার্স হেড অ্যান্ড শোল্ডার্স প্যাটার্ন গঠিত হয়েছে। হেড 201.64 -এ নির্ধারণ করা হয়েছে এবং নেকের মিডিয়ান লাইন 204.52/205.01 -এ নির্ধারণ করা হয়েছে। ইনভার্স হেড অ্যান্ড শোল্ডার্স
M5 এবং M15 টাইম ফ্রেমে আরও ভুল এন্ট্রি পয়েন্ট থাকতে পারে।
Open chart in a new window
বিয়ারিশ রেক্ট্যাঙ্গেল
was formed on 30.05 at 21:36:36 (UTC+0)
signal strength 1 of 5

M5 চার্ট অনুসারে, GBPAUD বিয়ারিশ রেক্ট্যাঙ্গেল গঠন করেছে যা চলমান প্রবণতার ধারাবাহিকতার প্যাটার্ন। প্যাটার্নটি নিম্নলিখিত সীমানার মধ্যে রয়েছে: নীচের সীমানা 2.0897 – 2.0897 এবং উপরের সীমানা 2.0908 – 2.0908৷ নীচের
M5 এবং M15 টাইম ফ্রেমে আরও ভুল এন্ট্রি পয়েন্ট থাকতে পারে।
Open chart in a new window


