

Pola sebenarnya

Triple Top
was formed on 31.03 at 10:00:28 (UTC+0)
signal strength 3 of 5

On the chart of the EURUSD M30 trading instrument, the Triple Top pattern that signals a trend change has formed. It is possible that after formation of the third peak, the price will try to break through the resistance level 1.0805, where we advise to open a trading position for sale. Take profit is the projection of the pattern’s width, which is 39 points.
Lihat juga
- All
- All
- Bearish Rectangle
- Bearish Symmetrical Triangle
- Bearish Symmetrical Triangle
- Bullish Rectangle
- Double Top
- Double Top
- Triple Bottom
- Triple Bottom
- Triple Top
- Triple Top
- All
- All
- Buy
- Sale
- All
- 1
- 2
- 3
- 4
- 5
Kepala dan Bahu Terbalik
was formed on 11.04 at 15:59:57 (UTC+0)
signal strength 3 of 5

Menurut grafik M30, AUDCHF menghasilkan pola yang disebut Kepala dan Bahu Terbalik. The Head ditetapkan di 0.5043 sementara garis median The Neck ditetapkan di 0.5120/0.5113. Formasi Pola Kepala dan Bahu
Open chart in a new window
Bawah Triple
was formed on 11.04 at 15:59:46 (UTC+0)
signal strength 3 of 5
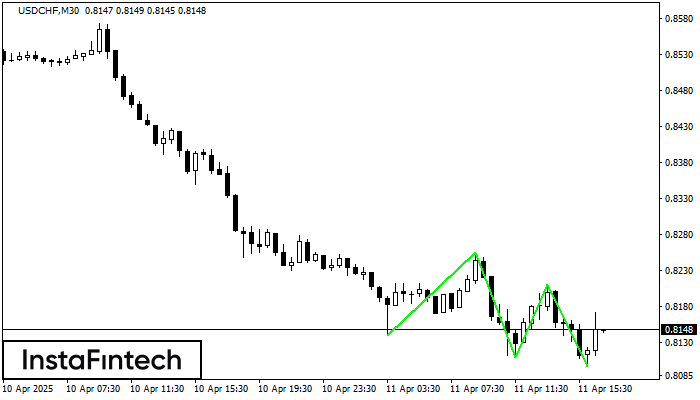
Pola Bawah Triple telah terbentuk pada grafik instrumen trading USDCHF M30. Pola tersebut menandakan perubahan dalam trend dari menurun menjadi naik jika terjadi pemecahan (breakdown) 0.8256/0.8211
Open chart in a new window
Bawah Triple
was formed on 11.04 at 15:45:01 (UTC+0)
signal strength 2 of 5
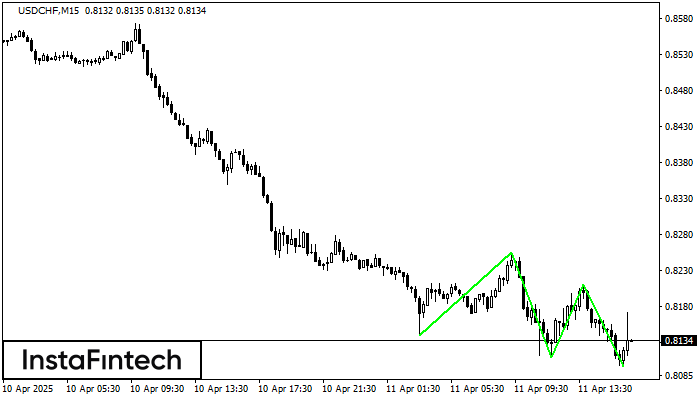
Pola Bawah Triple telah terbentuk pada grafik instrumen trading USDCHF M15. Pola tersebut menandakan perubahan dalam trend dari menurun menjadi naik jika terjadi pemecahan (breakdown) 0.8256/0.8211
Rangka waktu M5 dan M15 mungkin memiliki lebih dari titik entri yang keliru.
Open chart in a new window


