

Pola sebenarnya

Inverse Head and Shoulder
was formed on 11.04 at 15:59:57 (UTC+0)
signal strength 3 of 5

According to the chart of M30, AUDCHF produced the pattern termed the Inverse Head and Shoulder. The Head is fixed at 0.5043 while the median line of the Neck is set at 0.5120/0.5113. The formation of the Inverse Head and Shoulder Pattern clearly indicates a reversal of the downward trend. In means that in case the scenario comes true, the price of AUDCHF will go towards 0.5143.
- All
- All
- Bearish Rectangle
- Bearish Symmetrical Triangle
- Bearish Symmetrical Triangle
- Bullish Rectangle
- Double Top
- Double Top
- Triple Bottom
- Triple Bottom
- Triple Top
- Triple Top
- All
- All
- Buy
- Sale
- All
- 1
- 2
- 3
- 4
- 5
Double Bottom
сформирован 30.05 в 12:31:28 (UTC+0)
сила сигнала 3 из 5
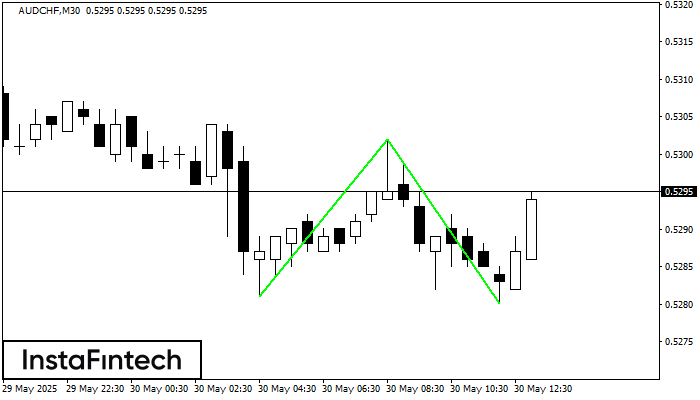
The Double Bottom pattern has been formed on AUDCHF M30. Characteristics: the support level 0.5281; the resistance level 0.5302; the width of the pattern 21 points. If the resistance level
Открыть график инструмента в новом окне
Double Bottom
сформирован 30.05 в 12:00:29 (UTC+0)
сила сигнала 2 из 5
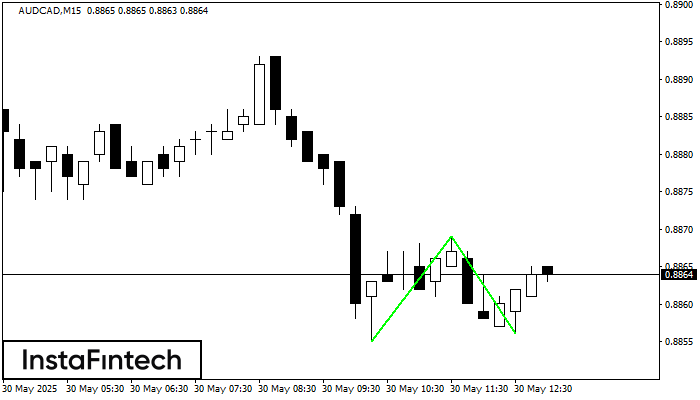
The Double Bottom pattern has been formed on AUDCAD M15; the upper boundary is 0.8869; the lower boundary is 0.8856. The width of the pattern is 14 points. In case
The M5 and M15 time frames may have more false entry points.
Открыть график инструмента в новом окне
Triple Bottom
сформирован 30.05 в 11:36:39 (UTC+0)
сила сигнала 1 из 5
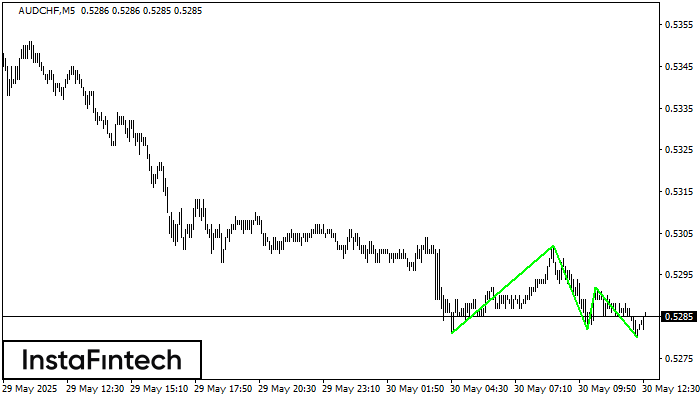
The Triple Bottom pattern has formed on the chart of AUDCHF M5. Features of the pattern: The lower line of the pattern has coordinates 0.5302 with the upper limit 0.5302/0.5292
The M5 and M15 time frames may have more false entry points.
Открыть график инструмента в новом окне


