

Pola sebenarnya

Inverse Head and Shoulder
was formed on 27.03 at 03:00:24 (UTC+0)
signal strength 2 of 5
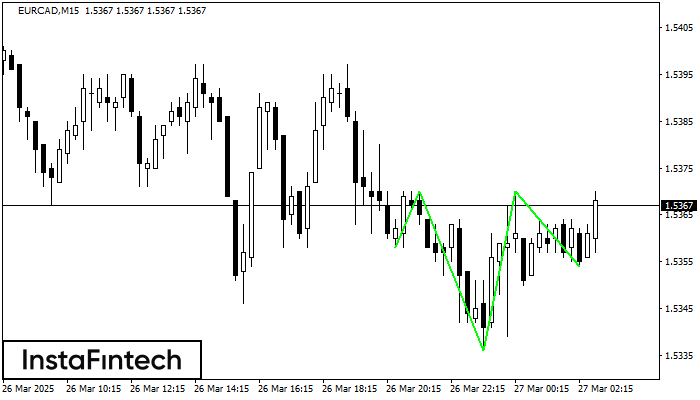
According to the chart of M15, EURCAD formed the Inverse Head and Shoulder pattern. The Head’s top is set at 1.5370 while the median line of the Neck is found at 1.5336/1.5354. The formation of the Inverse Head and Shoulder pattern evidently signals a reversal of the downward trend. In other words, in case the scenario comes true, the price of EURCAD will go towards 1.5393
The M5 and M15 time frames may have more false entry points.
Lihat juga
- All
- All
- Bearish Rectangle
- Bearish Symmetrical Triangle
- Bearish Symmetrical Triangle
- Bullish Rectangle
- Double Top
- Double Top
- Triple Bottom
- Triple Bottom
- Triple Top
- Triple Top
- All
- All
- Buy
- Sale
- All
- 1
- 2
- 3
- 4
- 5
Persegi Bullish
was formed on 23.04 at 16:30:47 (UTC+0)
signal strength 1 of 5
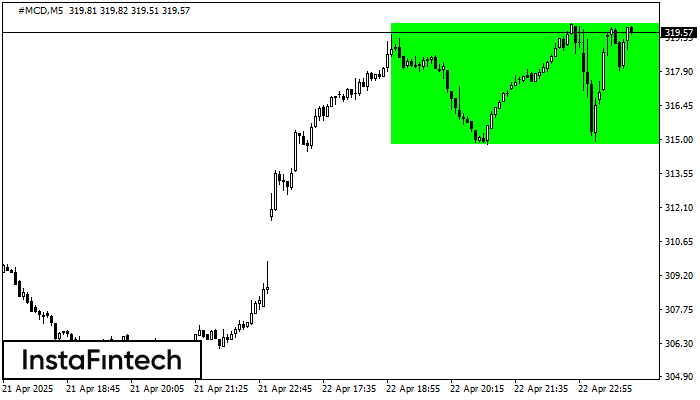
Menurut grafik dari M5, #MCD terbentuk Persegi Bullish. Pola menunjukkan kelanjutan tren. Batas atas adalah 319.97, batas lebih rendah adalah 314.80. Sinyal berarti posisi beli harus dibuka diatas batas atas
Rangka waktu M5 dan M15 mungkin memiliki lebih dari titik entri yang keliru.
Open chart in a new window
Persegi Bullish
was formed on 23.04 at 16:29:55 (UTC+0)
signal strength 2 of 5
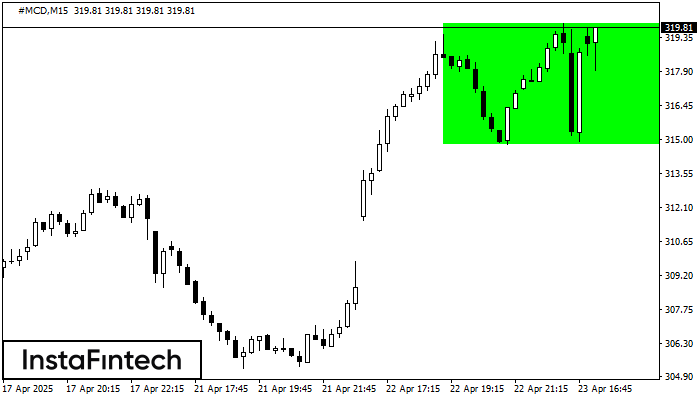
Menurut grafik dari M15, #MCD terbentuk Persegi Bullish. Pola menunjukkan kelanjutan tren. Batas atas adalah 319.97, batas lebih rendah adalah 314.80. Sinyal berarti posisi beli harus dibuka diatas batas atas
Rangka waktu M5 dan M15 mungkin memiliki lebih dari titik entri yang keliru.
Open chart in a new window
Teratas Triple
was formed on 23.04 at 16:29:41 (UTC+0)
signal strength 3 of 5
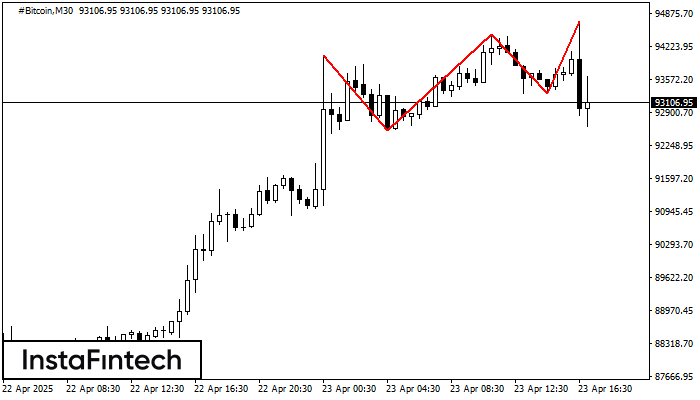
Pada grafik instrumen trading #Bitcoin M30, pola Teratas Triple yang menandakan perubahan trend telah terbentuk. Ada kemungkinan bahwa setelah pembentukan puncak (peak) ketiga, harga akan mencoba untuk menembus level resistance
Open chart in a new window


