

Pola sebenarnya

Triple Top
was formed on 23.04 at 16:29:41 (UTC+0)
signal strength 3 of 5
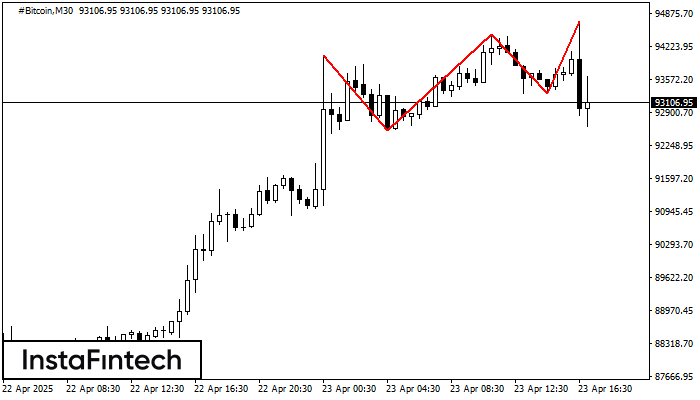
On the chart of the #Bitcoin M30 trading instrument, the Triple Top pattern that signals a trend change has formed. It is possible that after formation of the third peak, the price will try to break through the resistance level 92557.35, where we advise to open a trading position for sale. Take profit is the projection of the pattern’s width, which is 149255 points.
- All
- All
- Bearish Rectangle
- Bearish Symmetrical Triangle
- Bearish Symmetrical Triangle
- Bullish Rectangle
- Double Top
- Double Top
- Triple Bottom
- Triple Bottom
- Triple Top
- Triple Top
- All
- All
- Buy
- Sale
- All
- 1
- 2
- 3
- 4
- 5
Bearish Rectangle
was formed on 27.05 at 22:51:51 (UTC+0)
signal strength 3 of 5
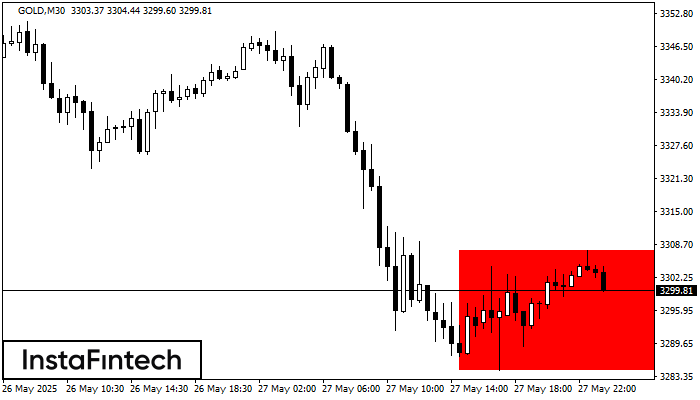
According to the chart of M30, GOLD formed the Bearish Rectangle which is a pattern of a trend continuation. The pattern is contained within the following borders: lower border 3284.62
Open chart in a new window
Double Bottom
was formed on 27.05 at 22:50:17 (UTC+0)
signal strength 1 of 5
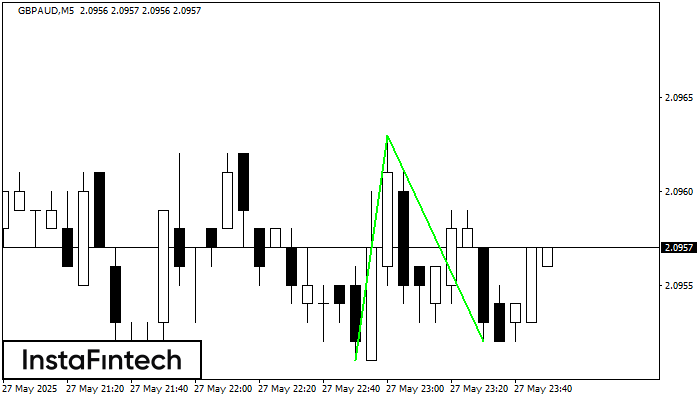
The Double Bottom pattern has been formed on GBPAUD M5; the upper boundary is 2.0963; the lower boundary is 2.0952. The width of the pattern is 12 points. In case
The M5 and M15 time frames may have more false entry points.
Open chart in a new window
Triple Bottom
was formed on 27.05 at 22:10:53 (UTC+0)
signal strength 1 of 5
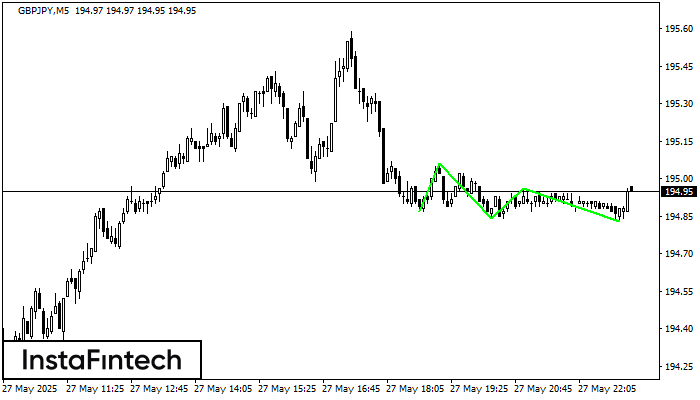
The Triple Bottom pattern has formed on the chart of the GBPJPY M5 trading instrument. The pattern signals a change in the trend from downwards to upwards in the case
The M5 and M15 time frames may have more false entry points.
Open chart in a new window


