

Pola sebenarnya

Double Bottom
was formed on 26.03 at 21:30:27 (UTC+0)
signal strength 2 of 5
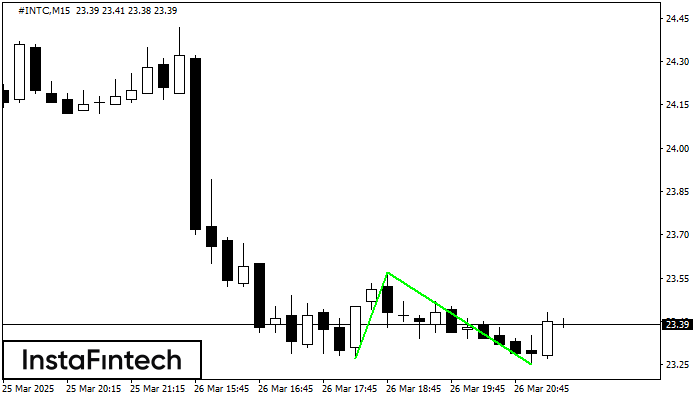
The Double Bottom pattern has been formed on #INTC M15. Characteristics: the support level 23.27; the resistance level 23.57; the width of the pattern 30 points. If the resistance level is broken, a change in the trend can be predicted with the first target point lying at the distance of 32 points.
The M5 and M15 time frames may have more false entry points.
- All
- All
- Bearish Rectangle
- Bearish Symmetrical Triangle
- Bearish Symmetrical Triangle
- Bullish Rectangle
- Double Top
- Double Top
- Triple Bottom
- Triple Bottom
- Triple Top
- Triple Top
- All
- All
- Buy
- Sale
- All
- 1
- 2
- 3
- 4
- 5
Bendera Bullish
was formed on 22.04 at 15:59:09 (UTC+0)
signal strength 1 of 5
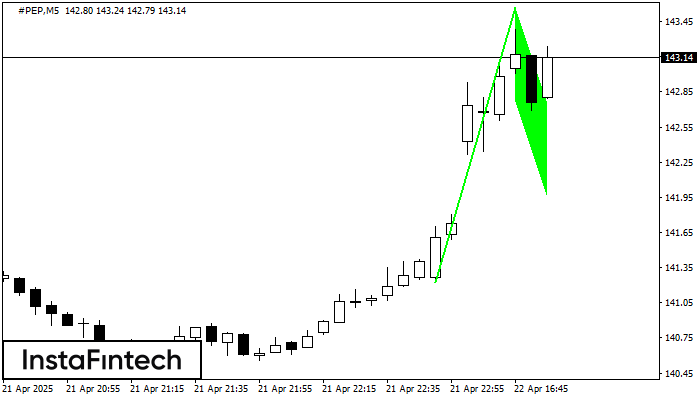
Pola Bendera Bullish yang memberikan sinyal kelanjutan tren telah terbentuk di grafik #PEP M5. Prakiraan: jika harga menembus ke atas titik tertinggi harga di 143.57, maka para trader akan dapat
Rangka waktu M5 dan M15 mungkin memiliki lebih dari titik entri yang keliru.
Open chart in a new window
Panji Bullish
was formed on 22.04 at 15:59:05 (UTC+0)
signal strength 1 of 5
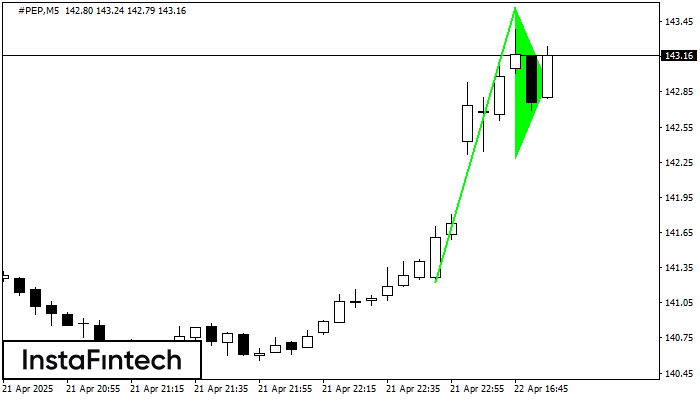
Sinyal Panji Bullish – instrumen trading #PEP M5, pola kelanjutan. Prakiraan: mungkin untuk mengatur posisi beli di atas titik tertinggi pola, di 143.57, dengan prospek pergerakan selanjutnya menjadi proyeksi titik
Rangka waktu M5 dan M15 mungkin memiliki lebih dari titik entri yang keliru.
Open chart in a new window
Bawah Ganda
was formed on 22.04 at 15:30:30 (UTC+0)
signal strength 4 of 5
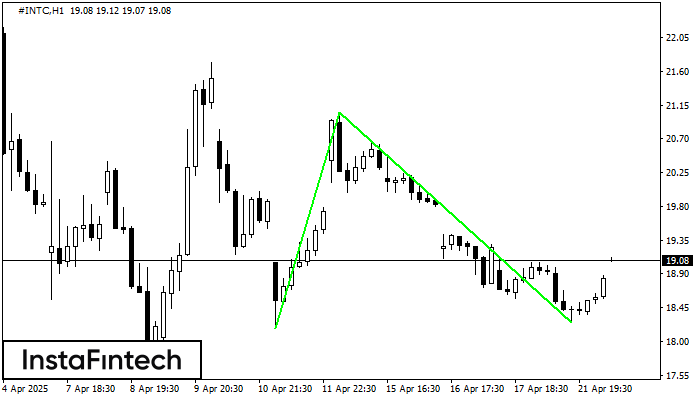
Pola Bawah Ganda telah terbentuk pada #INTC H1; batas atas di 21.05; batas bawah di 18.25. Lebar pola sebesar 287 poin. Jika harga menembus batas atas 21.05, Perubahan dalam tren
Open chart in a new window


