

Pola sebenarnya

Bullish Flag
was formed on 22.04 at 15:59:09 (UTC+0)
signal strength 1 of 5
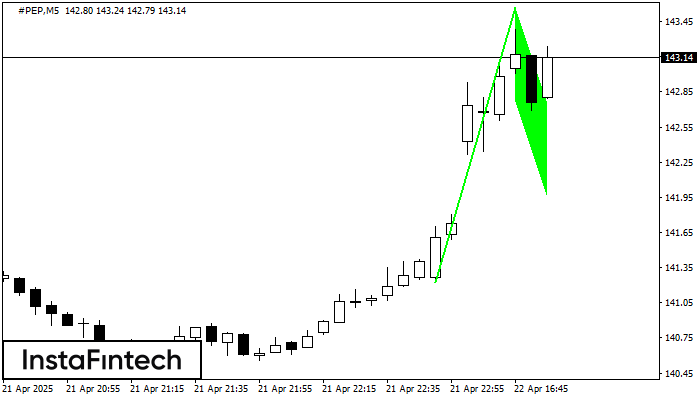
The Bullish Flag pattern which signals continuation of a trend has been formed on the chart #PEP M5. Forecast: if the price breaks above the pattern high at 143.57, then traders will be able to place a long deal with the target at 143.72.
The M5 and M15 time frames may have more false entry points.
Lihat juga
- All
- All
- Bearish Rectangle
- Bearish Symmetrical Triangle
- Bearish Symmetrical Triangle
- Bullish Rectangle
- Double Top
- Double Top
- Triple Bottom
- Triple Bottom
- Triple Top
- Triple Top
- All
- All
- Buy
- Sale
- All
- 1
- 2
- 3
- 4
- 5
Triple Top
was formed on 06.06 at 14:30:03 (UTC+0)
signal strength 3 of 5
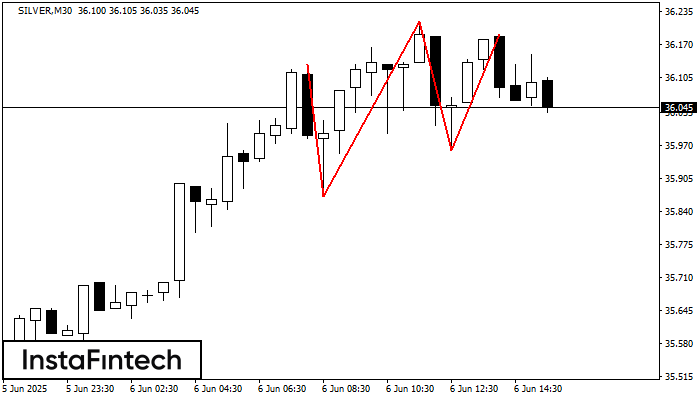
The Triple Top pattern has formed on the chart of the SILVER M30. Features of the pattern: borders have an ascending angle; the lower line of the pattern
Open chart in a new window
Head and Shoulders
was formed on 06.06 at 14:30:02 (UTC+0)
signal strength 3 of 5
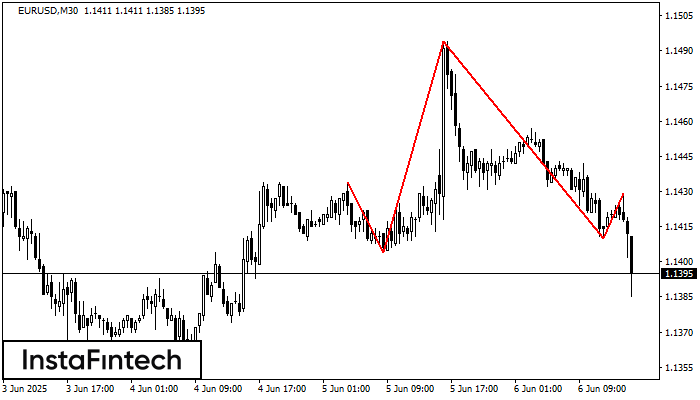
According to the chart of M30, EURUSD formed the Head and Shoulders pattern. The Head’s top is set at 1.1494 while the median line of the Neck is found
Open chart in a new window
Bullish Flag
was formed on 06.06 at 14:30:00 (UTC+0)
signal strength 2 of 5
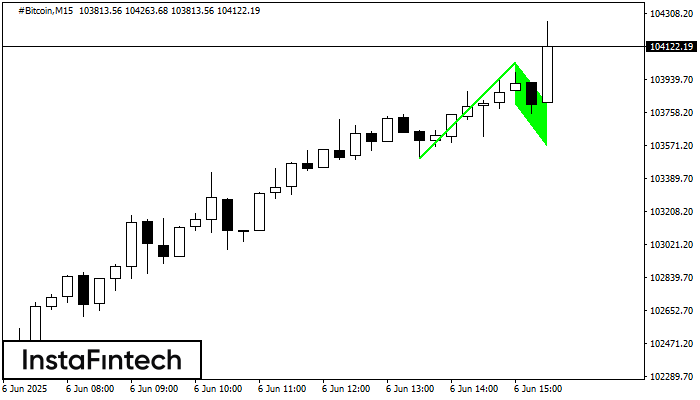
The Bullish Flag pattern has been formed on the chart #Bitcoin M15 which signals that the upward trend will continue. Signals: а break of the peak at 104036.62 may push
The M5 and M15 time frames may have more false entry points.
Open chart in a new window


