

النماذج الفعلية

النماذج هي نماذج رسومية تتشكل في الرسم البياني حسب السعر. وفقا لأحد المسلمات التحليلية الفنية، فإن التاريخ (حركة السعر) يكرر نفسه. ويعني ذلك أن حركات الأسعار غالباً ما تكون متشابهة في نفس الأوضاع مما يجعل من الممكن التنبؤ بزيادة تطوير الوضع الذي يتسم باحتمال كبير.
النماذج ذات الصلة المقدمة من قبل إنستافوركس هي خدمة سهلة الاستخدام تسمح لك بمعرفة التغييرات الأخيرة في السوق والرد على الأدلة من السوق في الوقت المناسب. في خدمتنا، ستجد دائمًا النماذج الأكثر حداثة وملاءمة في أي زوج وأي إطار زمني.
Bearish pennant
was formed on 02.04 at 14:55:25 (UTC+0)
signal strength 1 of 5
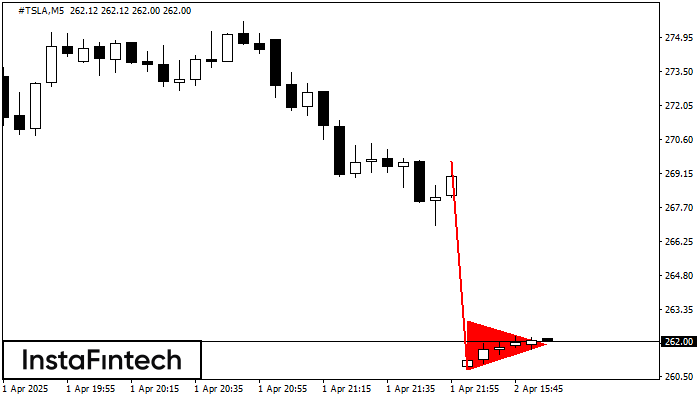
The Bearish pennant pattern has formed on the #TSLA M5 chart. It signals potential continuation of the existing trend. Specifications: the pattern’s bottom has the coordinate of 260.80; the projection of the flagpole height is equal to 887 pips. In case the price breaks out the pattern’s bottom of 260.80, the downtrend is expected to continue for further level 260.65.
The M5 and M15 time frames may have more false entry points.
- All
- All
- Bearish Rectangle
- Bearish Symmetrical Triangle
- Bearish Symmetrical Triangle
- Bullish Rectangle
- Double Top
- Double Top
- Triple Bottom
- Triple Bottom
- Triple Top
- Triple Top
- All
- All
- Buy
- Sale
- All
- 1
- 2
- 3
- 4
- 5
Bullish pennant
сформирован 25.04 в 16:14:55 (UTC+0)
сила сигнала 2 из 5
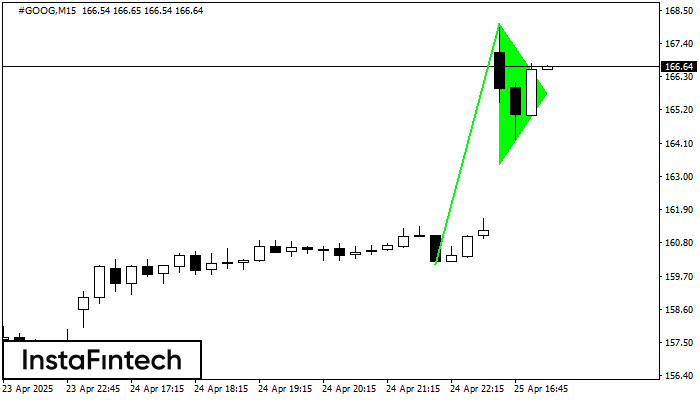
The Bullish pennant signal – Trading instrument #GOOG M15, continuation pattern. Forecast: it is possible to set up a buy position above the pattern’s high of 168.07, with the prospect
The M5 and M15 time frames may have more false entry points.
Открыть график инструмента в новом окне
Double Bottom
сформирован 25.04 в 15:59:55 (UTC+0)
сила сигнала 2 из 5
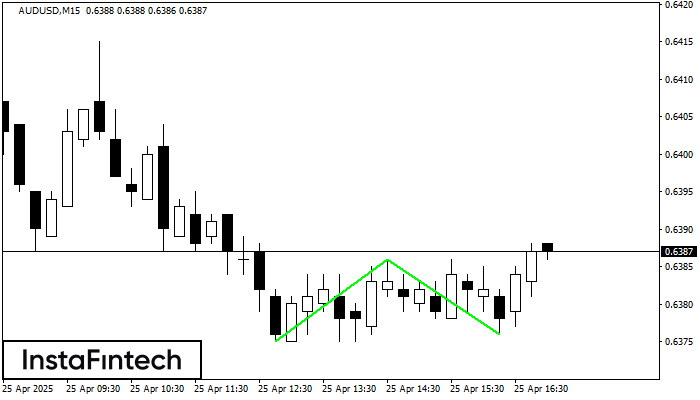
The Double Bottom pattern has been formed on AUDUSD M15; the upper boundary is 0.6386; the lower boundary is 0.6376. The width of the pattern is 11 points. In case
The M5 and M15 time frames may have more false entry points.
Открыть график инструмента в новом окне
Triple Top
сформирован 25.04 в 15:34:40 (UTC+0)
сила сигнала 1 из 5
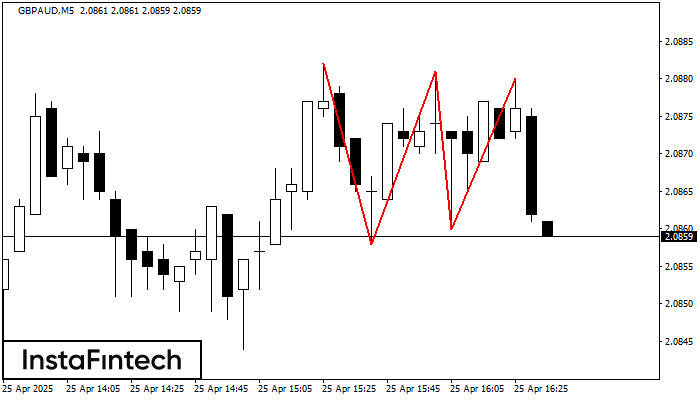
The Triple Top pattern has formed on the chart of the GBPAUD M5. Features of the pattern: borders have an ascending angle; the lower line of the pattern
The M5 and M15 time frames may have more false entry points.
Открыть график инструмента в новом окне


