

Өзекті паттерндер

Тройная вершина
сформирован 25.04 в 15:34:40 (UTC+0)
сила сигнала 1 из 5
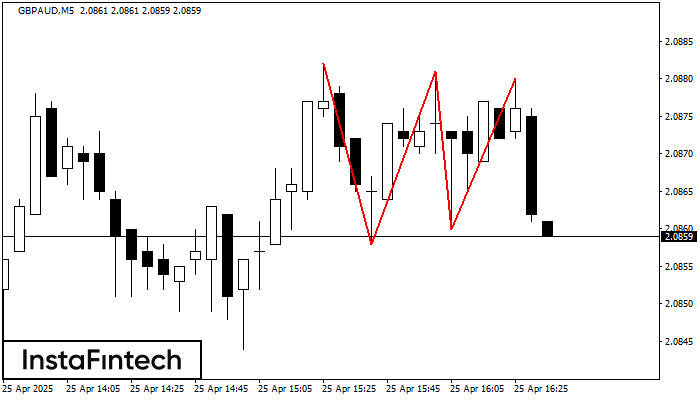
На графике GBPAUD M5 образовалась фигура «Тройная вершина», которая сигнализирует об изменении тенденции. Возможный сценарий: После формирования третьей вершины котировка постарается пробить нижнюю границу 2.0860, где трейдеру и стоило бы открывать торговую позицию на продажу. Тейк Профит - это и есть проекция ширины фигуры, которая составляет 21 пунктов.
Таймфреймы М5 и М15 могут иметь больше ложных точек входа.
Сондай-ақ қараңыз
- Все
- Все
- Bearish Rectangle
- Bearish Symmetrical Triangle
- Bearish Symmetrical Triangle
- Bullish Rectangle
- Double Top
- Double Top
- Triple Bottom
- Triple Bottom
- Triple Top
- Triple Top
- Все
- Все
- Покупка
- Продажа
- Все
- 1
- 2
- 3
- 4
- 5
Double Bottom
сформирован 05.08 в 10:00:07 (UTC+0)
сила сигнала 4 из 5
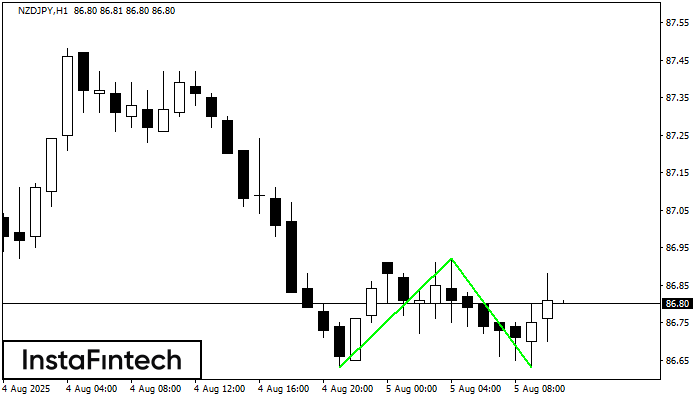
The Double Bottom pattern has been formed on NZDJPY H1. This formation signals a reversal of the trend from downwards to upwards. The signal is that a buy trade should
Открыть график инструмента в новом окне
Triple Bottom
сформирован 05.08 в 10:00:06 (UTC+0)
сила сигнала 4 из 5
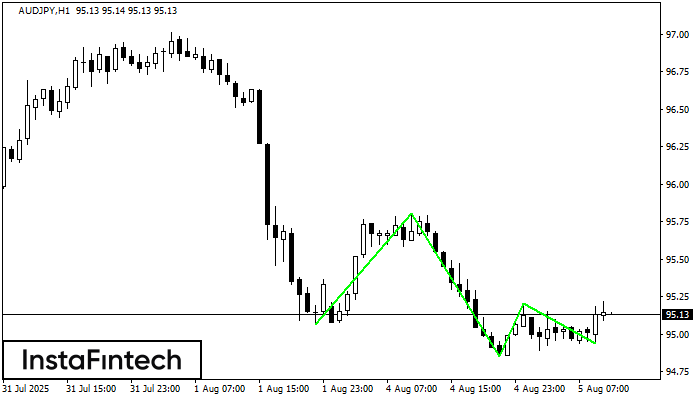
The Triple Bottom pattern has been formed on AUDJPY H1. It has the following characteristics: resistance level 95.80/95.20; support level 95.06/94.94; the width is 74 points. In the event
Открыть график инструмента в новом окне
Double Bottom
сформирован 05.08 в 09:30:12 (UTC+0)
сила сигнала 3 из 5
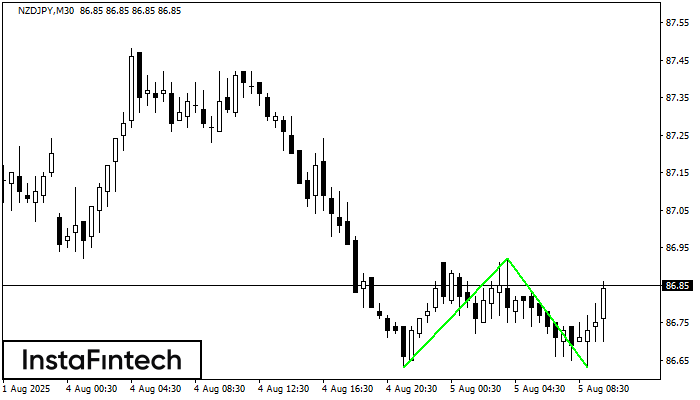
The Double Bottom pattern has been formed on NZDJPY M30. Characteristics: the support level 86.63; the resistance level 86.92; the width of the pattern 29 points. If the resistance level
Открыть график инструмента в новом окне


