

Các mẫu thực tế

Các mẫu là các mô hình đồ họa được hình thành trong biểu đồ theo giá. Theo một trong những định đề phân tích kỹ thuật, lịch sử (chuyển động giá) thường tự lặp lại. Có nghĩa là biến động giá thường giống nhau trong các tình huống giống nhau, do đó có thể dự đoán chuyển động tiếp theo của tình huống với xác suất cao.
Các mẫu hữu quan của InstaTrade là một dịch vụ dễ sử dụng cho phép bạn nhận biết được những thay đổi mới nhất trên thị trường và phản ứng kịp thời với các dấu hiệu từ thị trường. Trong dịch vụ của chúng tôi, bạn sẽ luôn tìm thấy các mẫu mới nhất và phù hợp nhất trên bất kỳ cặp nào và bất kỳ khung thời gian nào.
Triple Top
was formed on 27.04 at 23:00:30 (UTC+0)
signal strength 1 of 5
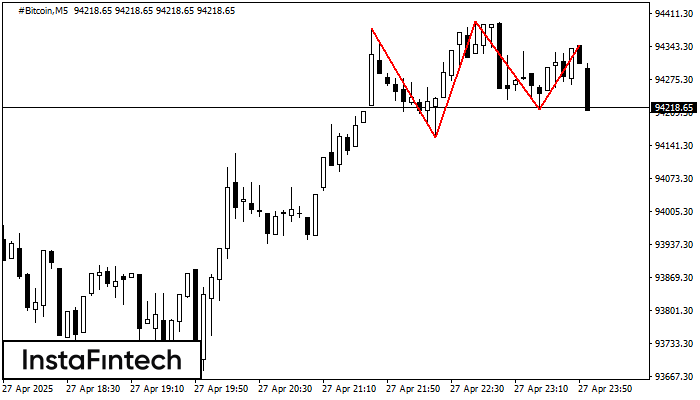
The Triple Top pattern has formed on the chart of the #Bitcoin M5 trading instrument. It is a reversal pattern featuring the following characteristics: resistance level 3568, support level -5728, and pattern’s width 22382. Forecast If the price breaks through the support level 94157.00, it is likely to move further down to 94395.22.
The M5 and M15 time frames may have more false entry points.
- All
- All
- Bearish Rectangle
- Bearish Symmetrical Triangle
- Bearish Symmetrical Triangle
- Bullish Rectangle
- Double Top
- Double Top
- Triple Bottom
- Triple Bottom
- Triple Top
- Triple Top
- All
- All
- Buy
- Sale
- All
- 1
- 2
- 3
- 4
- 5
Tam giác Cân Tăng
was formed on 28.05 at 10:04:32 (UTC+0)
signal strength 2 of 5
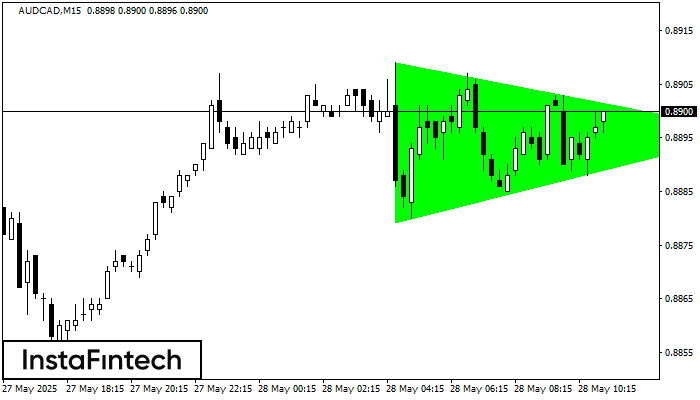
Theo biểu đồ của M15, AUDCAD đã hình thành mô hình Tam giác Cân Tăng. Đường biên giới thấp hơn của mô hình chạm tọa độ 0.8879/0.8896 trong khi đường
Khung thời gian M5 và M15 có thể có nhiều điểm vào lệnh sai hơn.
Open chart in a new window
Cờ hiệu giảm
was formed on 28.05 at 08:12:58 (UTC+0)
signal strength 1 of 5

Mô hình Cờ hiệu giảm đã được hình thành trên biểu đồ GBPJPY M5. Nó báo hiệu tiềm năng tiếp tục của xu hướng hiện tại. Thông số kỹ thuật
Khung thời gian M5 và M15 có thể có nhiều điểm vào lệnh sai hơn.
Open chart in a new window
Tam giác Cân Tăng
was formed on 28.05 at 07:55:36 (UTC+0)
signal strength 1 of 5

Theo biểu đồ của M5, GBPAUD đã hình thành mô hình Tam giác Cân Tăng, điều mà báo hiệu xu hướng sẽ tiếp tục. Mô tả. Đường biên giới
Khung thời gian M5 và M15 có thể có nhiều điểm vào lệnh sai hơn.
Open chart in a new window
