

Các mẫu thực tế

Các mẫu là các mô hình đồ họa được hình thành trong biểu đồ theo giá. Theo một trong những định đề phân tích kỹ thuật, lịch sử (chuyển động giá) thường tự lặp lại. Có nghĩa là biến động giá thường giống nhau trong các tình huống giống nhau, do đó có thể dự đoán chuyển động tiếp theo của tình huống với xác suất cao.
Các mẫu hữu quan của InstaTrade là một dịch vụ dễ sử dụng cho phép bạn nhận biết được những thay đổi mới nhất trên thị trường và phản ứng kịp thời với các dấu hiệu từ thị trường. Trong dịch vụ của chúng tôi, bạn sẽ luôn tìm thấy các mẫu mới nhất và phù hợp nhất trên bất kỳ cặp nào và bất kỳ khung thời gian nào.
Bullish Symmetrical Triangle
was formed on 24.04 at 22:24:37 (UTC+0)
signal strength 1 of 5
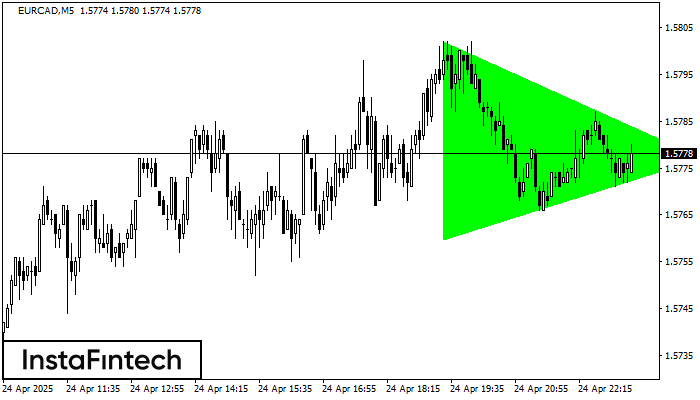
According to the chart of M5, EURCAD formed the Bullish Symmetrical Triangle pattern, which signals the trend will continue. Description. The upper border of the pattern touches the coordinates 1.5802/1.5777 whereas the lower border goes across 1.5760/1.5777. The pattern width is measured on the chart at 42 pips. If the Bullish Symmetrical Triangle pattern is in progress during the upward trend, this indicates the current trend will go on. In case 1.5777 is broken, the price could continue its move toward 1.5792.
The M5 and M15 time frames may have more false entry points.
Xem thêm
- All
- All
- Bearish Rectangle
- Bearish Symmetrical Triangle
- Bearish Symmetrical Triangle
- Bullish Rectangle
- Double Top
- Double Top
- Triple Bottom
- Triple Bottom
- Triple Top
- Triple Top
- All
- All
- Buy
- Sale
- All
- 1
- 2
- 3
- 4
- 5
Teratas Ganda
was formed on 22.08 at 07:30:33 (UTC+0)
signal strength 3 of 5
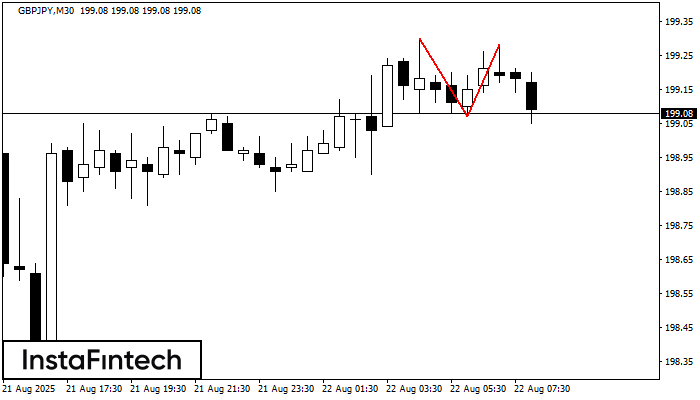
Pola reversal Teratas Ganda telah terbentuk pada GBPJPY M30. Karakteristik: batas atas 199.30; batas bawah 199.07; lebar pola 21 poin. Transaksi jual lebih baik dibuka di bawah batas bawah 199.07
Open chart in a new window
Persegi Bearish
was formed on 22.08 at 06:30:53 (UTC+0)
signal strength 4 of 5
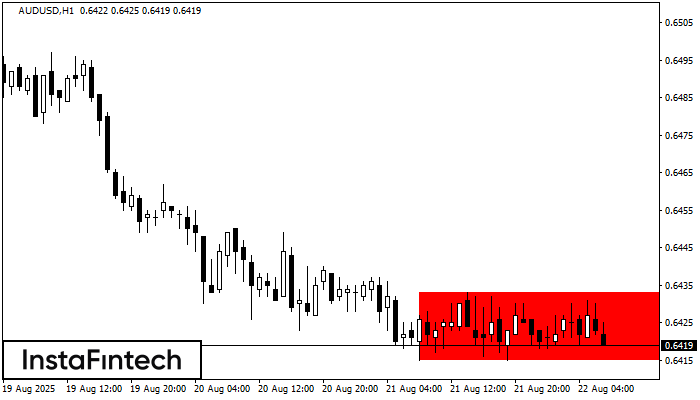
Menurut grafik dari H1, AUDUSD terbentuk Persegi Bearish. Pola menunjukkan kelanjutan tren. Batas atas adalah 0.6433, batas rendah adalah 0.6415. Sinyal berarti posisi jual harus dibuka setelah menetapkan harga dibawah
Open chart in a new window
Teratas Ganda
was formed on 22.08 at 06:25:28 (UTC+0)
signal strength 1 of 5
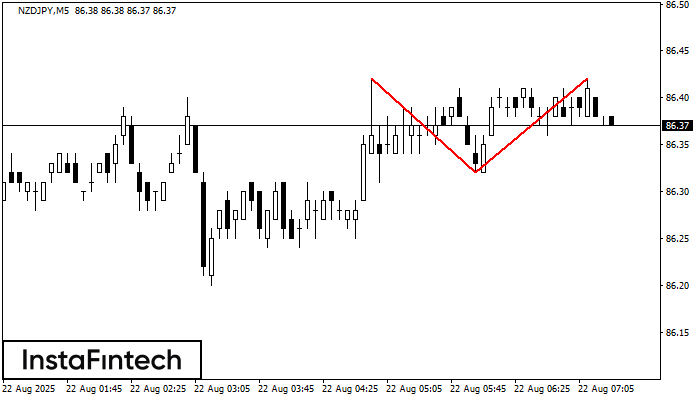
Pola reversal Teratas Ganda telah terbentuk pada NZDJPY M5. Karakteristik: batas atas 86.42; batas bawah 86.32; lebar pola 10 poin. Transaksi jual lebih baik dibuka di bawah batas bawah 86.32
Rangka waktu M5 dan M15 mungkin memiliki lebih dari titik entri yang keliru.
Open chart in a new window
