

Các mẫu thực tế

Các mẫu là các mô hình đồ họa được hình thành trong biểu đồ theo giá. Theo một trong những định đề phân tích kỹ thuật, lịch sử (chuyển động giá) thường tự lặp lại. Có nghĩa là biến động giá thường giống nhau trong các tình huống giống nhau, do đó có thể dự đoán chuyển động tiếp theo của tình huống với xác suất cao.
Các mẫu hữu quan của InstaTrade là một dịch vụ dễ sử dụng cho phép bạn nhận biết được những thay đổi mới nhất trên thị trường và phản ứng kịp thời với các dấu hiệu từ thị trường. Trong dịch vụ của chúng tôi, bạn sẽ luôn tìm thấy các mẫu mới nhất và phù hợp nhất trên bất kỳ cặp nào và bất kỳ khung thời gian nào.
Bearish Rectangle
was formed on 09.04 at 01:24:35 (UTC+0)
signal strength 2 of 5
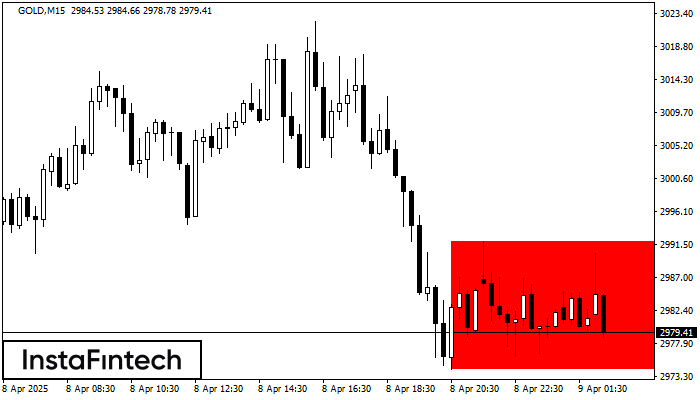
According to the chart of M15, GOLD formed the Bearish Rectangle. This type of a pattern indicates a trend continuation. It consists of two levels: resistance 2991.89 - 0.00 and support 2974.26 – 2974.26. In case the resistance level 2974.26 - 2974.26 is broken, the instrument is likely to follow the bearish trend.
The M5 and M15 time frames may have more false entry points.
Xem thêm
- All
- All
- Bearish Rectangle
- Bearish Symmetrical Triangle
- Bearish Symmetrical Triangle
- Bullish Rectangle
- Double Top
- Double Top
- Triple Bottom
- Triple Bottom
- Triple Top
- Triple Top
- All
- All
- Buy
- Sale
- All
- 1
- 2
- 3
- 4
- 5
Đáy đôi
was formed on 14.08 at 00:45:39 (UTC+0)
signal strength 2 of 5
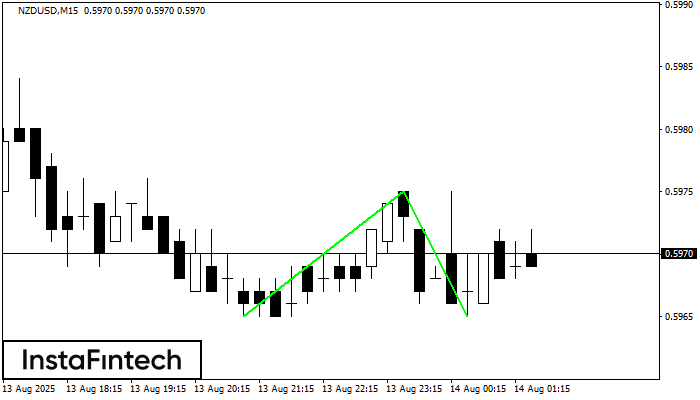
Mô hình Đáy đôi đã được hình thành trên NZDUSD M15. Sự hình thành này báo hiệu sự đảo chiều của xu hướng từ dưới lên trên. Tín hiệu
Khung thời gian M5 và M15 có thể có nhiều điểm vào lệnh sai hơn.
Open chart in a new window
Đáy đôi
was formed on 13.08 at 23:10:26 (UTC+0)
signal strength 1 of 5
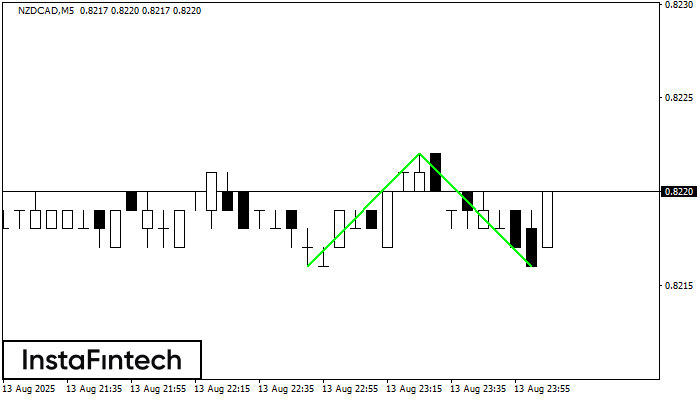
Mô hình Đáy đôi đã được hình thành trên NZDCAD M5; đường viền trên là 0.8222; đường viền dưới là 0.8216. Độ rộng của mô hình là 6 điểm. Trong
Khung thời gian M5 và M15 có thể có nhiều điểm vào lệnh sai hơn.
Open chart in a new window
Đỉnh ba
was formed on 13.08 at 22:50:57 (UTC+0)
signal strength 1 of 5
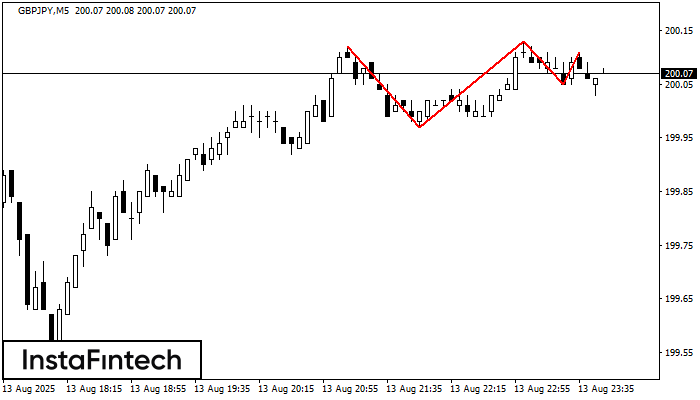
Mô hình Đỉnh ba đã được hình thành trên biểu đồ của công cụ giao dịch GBPJPY M5. Đó là mô hình đảo chiều có các đặc điểm
Khung thời gian M5 và M15 có thể có nhiều điểm vào lệnh sai hơn.
Open chart in a new window
