

Các mẫu thực tế

Các mẫu là các mô hình đồ họa được hình thành trong biểu đồ theo giá. Theo một trong những định đề phân tích kỹ thuật, lịch sử (chuyển động giá) thường tự lặp lại. Có nghĩa là biến động giá thường giống nhau trong các tình huống giống nhau, do đó có thể dự đoán chuyển động tiếp theo của tình huống với xác suất cao.
Các mẫu hữu quan của InstaTrade là một dịch vụ dễ sử dụng cho phép bạn nhận biết được những thay đổi mới nhất trên thị trường và phản ứng kịp thời với các dấu hiệu từ thị trường. Trong dịch vụ của chúng tôi, bạn sẽ luôn tìm thấy các mẫu mới nhất và phù hợp nhất trên bất kỳ cặp nào và bất kỳ khung thời gian nào.
Bullish Symmetrical Triangle
was formed on 08.04 at 16:25:23 (UTC+0)
signal strength 1 of 5
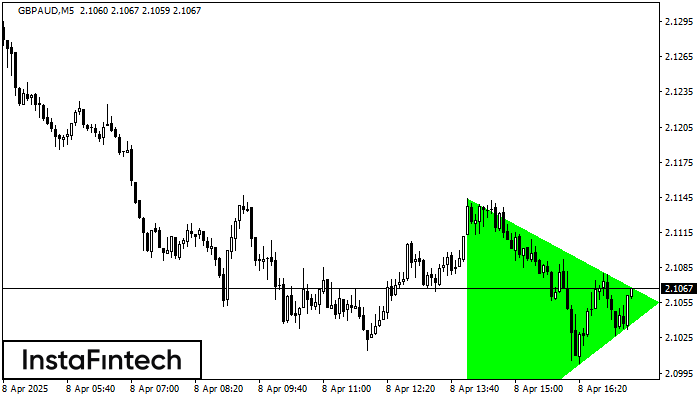
According to the chart of M5, GBPAUD formed the Bullish Symmetrical Triangle pattern. The lower border of the pattern touches the coordinates 2.0928/2.1055 whereas the upper border goes across 2.1144/2.1055. If the Bullish Symmetrical Triangle pattern is in progress, this evidently signals a further upward trend. In other words, in case the scenario comes true, the price of GBPAUD will breach the upper border to head for 2.1070.
The M5 and M15 time frames may have more false entry points.
Xem thêm
- All
- All
- Bearish Rectangle
- Bearish Symmetrical Triangle
- Bearish Symmetrical Triangle
- Bullish Rectangle
- Double Top
- Double Top
- Triple Bottom
- Triple Bottom
- Triple Top
- Triple Top
- All
- All
- Buy
- Sale
- All
- 1
- 2
- 3
- 4
- 5
Đáy đôi
was formed on 31.05 at 13:20:01 (UTC+0)
signal strength 1 of 5

Mô hình Đáy đôi đã được hình thành trên #Bitcoin M5. Đặc điểm: mức hỗ trợ 103250.25; mức kháng cự 103385.09; chiều rộng của mô hình 13484 điểm
Khung thời gian M5 và M15 có thể có nhiều điểm vào lệnh sai hơn.
Open chart in a new window
Đỉnh ba
was formed on 30.05 at 22:20:23 (UTC+0)
signal strength 1 of 5

Mô hình Đỉnh ba đã được hình thành trên biểu đồ của công cụ giao dịch GOLD M5. Đó là mô hình đảo chiều có các đặc điểm
Khung thời gian M5 và M15 có thể có nhiều điểm vào lệnh sai hơn.
Open chart in a new window
Đảo đầu và vai
was formed on 30.05 at 21:50:24 (UTC+0)
signal strength 1 of 5

Theo biểu đồ của M5, #AMZN đã tạo ra mô hình Đảo đầu và vai. Đầu được cố định ở 201.64 trong khi đường trung bình của Cổ được
Khung thời gian M5 và M15 có thể có nhiều điểm vào lệnh sai hơn.
Open chart in a new window
