

Các mẫu thực tế

Các mẫu là các mô hình đồ họa được hình thành trong biểu đồ theo giá. Theo một trong những định đề phân tích kỹ thuật, lịch sử (chuyển động giá) thường tự lặp lại. Có nghĩa là biến động giá thường giống nhau trong các tình huống giống nhau, do đó có thể dự đoán chuyển động tiếp theo của tình huống với xác suất cao.
Các mẫu hữu quan của InstaTrade là một dịch vụ dễ sử dụng cho phép bạn nhận biết được những thay đổi mới nhất trên thị trường và phản ứng kịp thời với các dấu hiệu từ thị trường. Trong dịch vụ của chúng tôi, bạn sẽ luôn tìm thấy các mẫu mới nhất và phù hợp nhất trên bất kỳ cặp nào và bất kỳ khung thời gian nào.
Triple Top
was formed on 07.04 at 05:50:18 (UTC+0)
signal strength 1 of 5
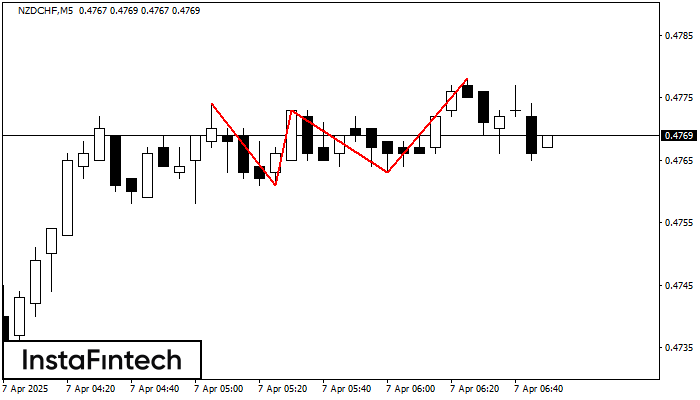
On the chart of the NZDCHF M5 trading instrument, the Triple Top pattern that signals a trend change has formed. It is possible that after formation of the third peak, the price will try to break through the resistance level 0.4761, where we advise to open a trading position for sale. Take profit is the projection of the pattern’s width, which is 13 points.
The M5 and M15 time frames may have more false entry points.
Xem thêm
- All
- All
- Bearish Rectangle
- Bearish Symmetrical Triangle
- Bearish Symmetrical Triangle
- Bullish Rectangle
- Double Top
- Double Top
- Triple Bottom
- Triple Bottom
- Triple Top
- Triple Top
- All
- All
- Buy
- Sale
- All
- 1
- 2
- 3
- 4
- 5
Fundo duplo
was formed on 21.11 at 10:59:55 (UTC+0)
signal strength 3 of 5

O padrão Fundo duplo foi formado em NZDCHF M30. Características: o nível de suporte 0.4493; o nível de resistência 0.4505; a largura do padrão 12 pontos. Se o nível
Open chart in a new window
Cabeça & Ombro Invertidos
was formed on 21.11 at 10:59:55 (UTC+0)
signal strength 3 of 5
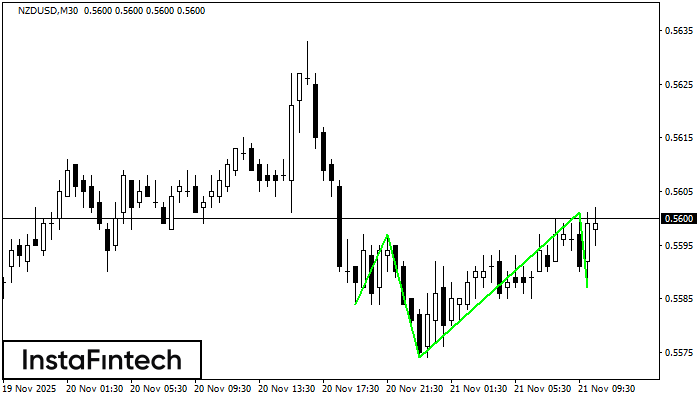
De acordo com o gráfico de M30, NZDUSD formou o padrão Cabeça & Ombro Invertidos. O topo da Cabeça é definido em 0.5601 enquanto a linha mediana do Pescoço
Open chart in a new window
Retângulo de baixa
was formed on 21.11 at 09:45:42 (UTC+0)
signal strength 2 of 5
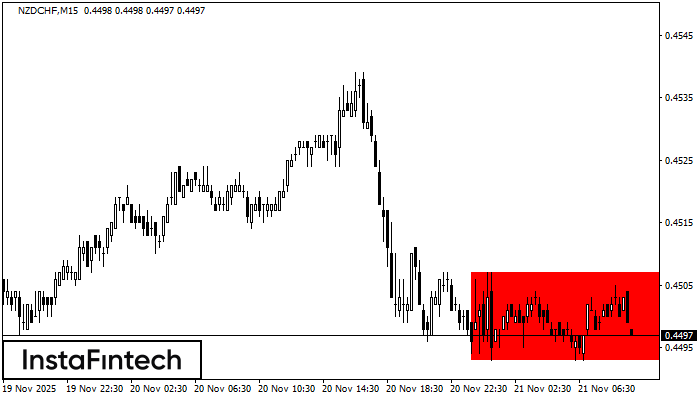
De acordo com o gráfico de M15, NZDCHF formou Retângulo de baixa. O padrão indica uma continuação da tendência. O limite superior é 0.4507, o limite inferior é 0.4493
Os intervalos M5 e M15 podem ter mais pontos de entrada falsos.
Open chart in a new window
