

Các mẫu thực tế

Các mẫu là các mô hình đồ họa được hình thành trong biểu đồ theo giá. Theo một trong những định đề phân tích kỹ thuật, lịch sử (chuyển động giá) thường tự lặp lại. Có nghĩa là biến động giá thường giống nhau trong các tình huống giống nhau, do đó có thể dự đoán chuyển động tiếp theo của tình huống với xác suất cao.
Các mẫu hữu quan của InstaTrade là một dịch vụ dễ sử dụng cho phép bạn nhận biết được những thay đổi mới nhất trên thị trường và phản ứng kịp thời với các dấu hiệu từ thị trường. Trong dịch vụ của chúng tôi, bạn sẽ luôn tìm thấy các mẫu mới nhất và phù hợp nhất trên bất kỳ cặp nào và bất kỳ khung thời gian nào.
Inverse Head and Shoulder
was formed on 29.03 at 22:00:17 (UTC+0)
signal strength 2 of 5

According to the chart of M15, #Bitcoin produced the pattern termed the Inverse Head and Shoulder. The Head is fixed at 81609.29 while the median line of the Neck is set at 82839.07/82640.15. The formation of the Inverse Head and Shoulder Pattern clearly indicates a reversal of the downward trend. In means that in case the scenario comes true, the price of #Bitcoin will go towards 82640.38.
The M5 and M15 time frames may have more false entry points.
- All
- All
- Bearish Rectangle
- Bearish Symmetrical Triangle
- Bearish Symmetrical Triangle
- Bullish Rectangle
- Double Top
- Double Top
- Triple Bottom
- Triple Bottom
- Triple Top
- Triple Top
- All
- All
- Buy
- Sale
- All
- 1
- 2
- 3
- 4
- 5
Fundo duplo
was formed on 05.06 at 22:50:11 (UTC+0)
signal strength 1 of 5
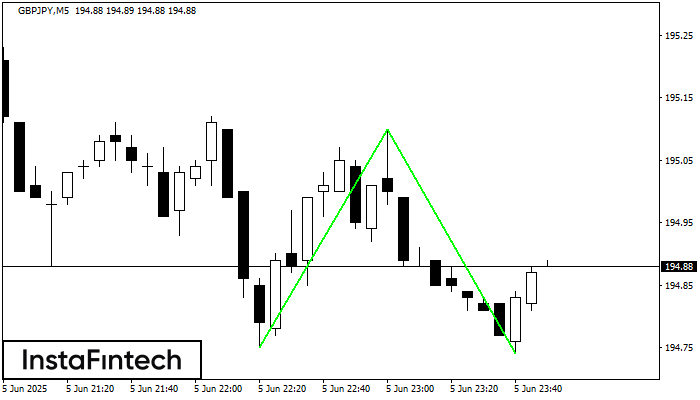
O padrão Fundo duplo foi formado em GBPJPY M5; o limite superior é 195.10; o limite inferior é 194.74. A largura do padrão é de 35 pontos. No caso
Os intervalos M5 e M15 podem ter mais pontos de entrada falsos.
Open chart in a new window
Cabeça & Ombro Invertidos
was formed on 05.06 at 21:40:13 (UTC+0)
signal strength 1 of 5

De acordo com o gráfico de M5, #MCD produziu o padrão denominado Cabeça & Ombro Invertidos. A Cabeça é definida em 307.79 enquanto a linha mediana do Pescoço é definida
Os intervalos M5 e M15 podem ter mais pontos de entrada falsos.
Open chart in a new window
Triângulo Simétrico de Baixa
was formed on 05.06 at 21:16:00 (UTC+0)
signal strength 1 of 5
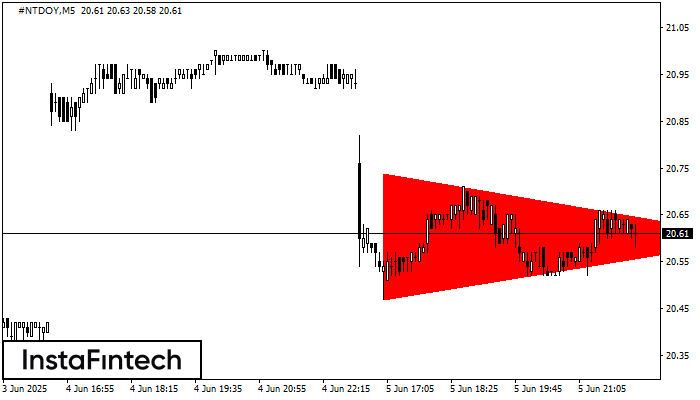
De acordo com o gráfico de M5, #NTDOY formou o padrão Triângulo Simétrico de Baixa. Descrição: o limite inferior é 20.47/20.60 e o limite superior é 20.74/20.60. A largura
Os intervalos M5 e M15 podem ter mais pontos de entrada falsos.
Open chart in a new window
