

Các mẫu thực tế

Các mẫu là các mô hình đồ họa được hình thành trong biểu đồ theo giá. Theo một trong những định đề phân tích kỹ thuật, lịch sử (chuyển động giá) thường tự lặp lại. Có nghĩa là biến động giá thường giống nhau trong các tình huống giống nhau, do đó có thể dự đoán chuyển động tiếp theo của tình huống với xác suất cao.
Các mẫu hữu quan của InstaTrade là một dịch vụ dễ sử dụng cho phép bạn nhận biết được những thay đổi mới nhất trên thị trường và phản ứng kịp thời với các dấu hiệu từ thị trường. Trong dịch vụ của chúng tôi, bạn sẽ luôn tìm thấy các mẫu mới nhất và phù hợp nhất trên bất kỳ cặp nào và bất kỳ khung thời gian nào.
Double Bottom
was formed on 26.03 at 05:00:28 (UTC+0)
signal strength 4 of 5
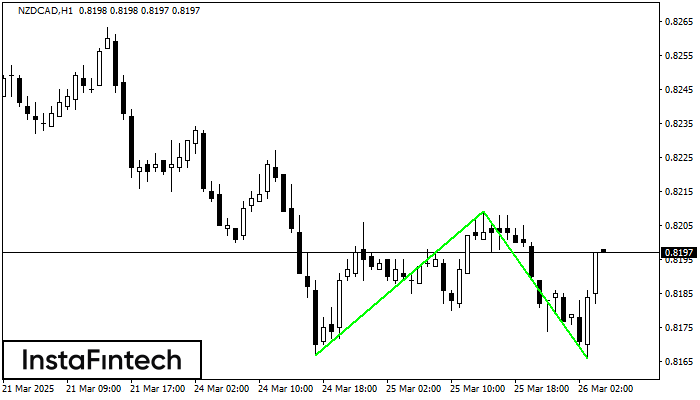
The Double Bottom pattern has been formed on NZDCAD H1; the upper boundary is 0.8209; the lower boundary is 0.8166. The width of the pattern is 42 points. In case of a break of the upper boundary 0.8209, a change in the trend can be predicted where the width of the pattern will coincide with the distance to a possible take profit level.
Xem thêm
- All
- All
- Bearish Rectangle
- Bearish Symmetrical Triangle
- Bearish Symmetrical Triangle
- Bullish Rectangle
- Double Top
- Double Top
- Triple Bottom
- Triple Bottom
- Triple Top
- Triple Top
- All
- All
- Buy
- Sale
- All
- 1
- 2
- 3
- 4
- 5
Tam giác Cân Tăng
was formed on 19.09 at 22:55:34 (UTC+0)
signal strength 1 of 5
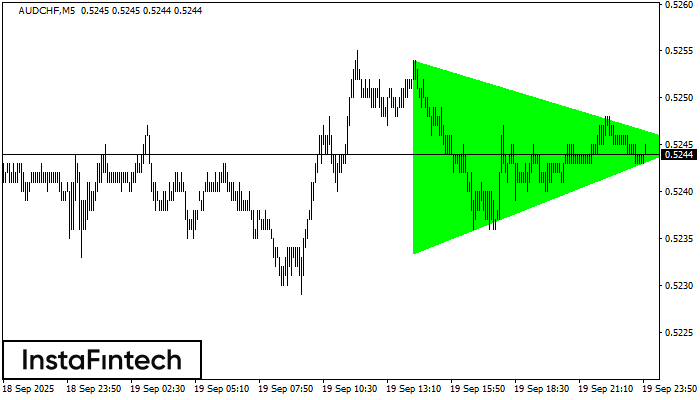
Theo biểu đồ của M5, AUDCHF đã hình thành mô hình Tam giác Cân Tăng. Đường biên giới thấp hơn của mô hình chạm tọa độ 0.5233/0.5245 trong khi đường
Khung thời gian M5 và M15 có thể có nhiều điểm vào lệnh sai hơn.
Open chart in a new window
Hình chữ nhật giảm
was formed on 19.09 at 22:35:09 (UTC+0)
signal strength 1 of 5
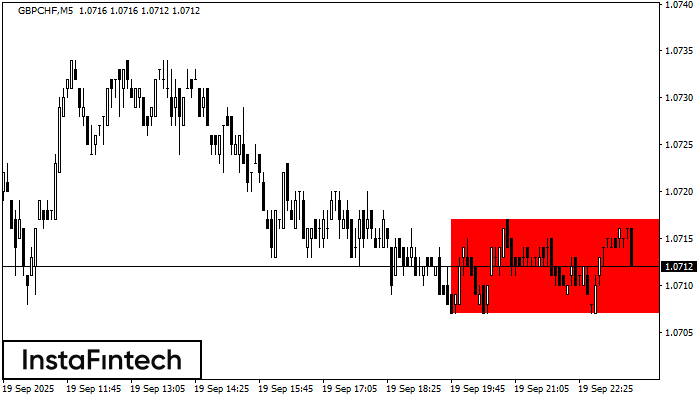
Theo biểu đồ của M5, GBPCHF đã hình thành Hình chữ nhật giảm, cái mà là mô hình của sự tiếp tục xu hướng. Mô hình được chứa trong
Khung thời gian M5 và M15 có thể có nhiều điểm vào lệnh sai hơn.
Open chart in a new window
Tam giác Cân Giảm
was formed on 19.09 at 22:32:37 (UTC+0)
signal strength 3 of 5
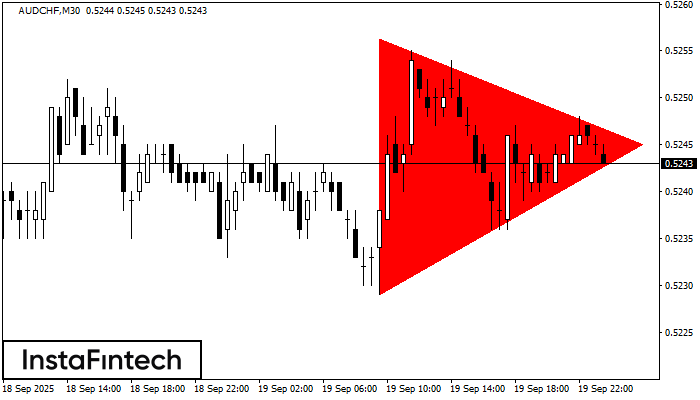
Theo biểu đồ của M30, AUDCHF đã hình thành mô hình Tam giác Cân Giảm. Khuyến nghị giao dịch: Việc vi phạm biên giới thấp hơn 0.5229 có khả năng
Open chart in a new window
