

Các mẫu thực tế

Các mẫu là các mô hình đồ họa được hình thành trong biểu đồ theo giá. Theo một trong những định đề phân tích kỹ thuật, lịch sử (chuyển động giá) thường tự lặp lại. Có nghĩa là biến động giá thường giống nhau trong các tình huống giống nhau, do đó có thể dự đoán chuyển động tiếp theo của tình huống với xác suất cao.
Các mẫu hữu quan của InstaTrade là một dịch vụ dễ sử dụng cho phép bạn nhận biết được những thay đổi mới nhất trên thị trường và phản ứng kịp thời với các dấu hiệu từ thị trường. Trong dịch vụ của chúng tôi, bạn sẽ luôn tìm thấy các mẫu mới nhất và phù hợp nhất trên bất kỳ cặp nào và bất kỳ khung thời gian nào.
Bullish Flag
was formed on 19.02 at 15:35:37 (UTC+0)
signal strength 3 of 5
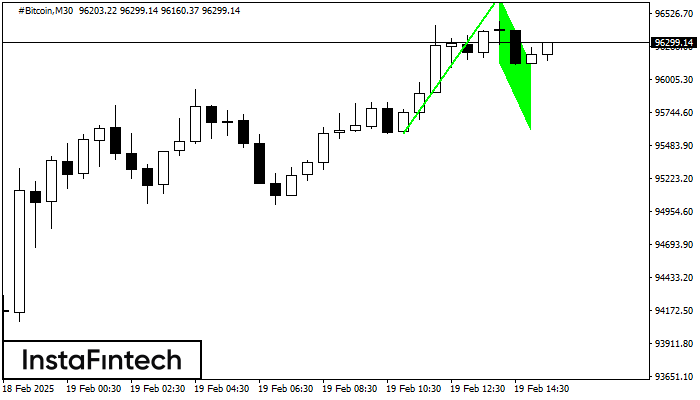
The Bullish Flag pattern has been formed on #Bitcoin at M30. The lower boundary of the pattern is located at 96134.47/95596.99, while the higher boundary lies at 96666.01/96128.53. The projection of the flagpole is 109249 points. This formation signals that the upward trend is most likely to continue. Therefore, if the level of 96666.01 is broken, the price will move further upwards.

