

Dolzarb patternlar

Двойная вершина
сформирован 29.04 в 21:15:24 (UTC+0)
сила сигнала 2 из 5
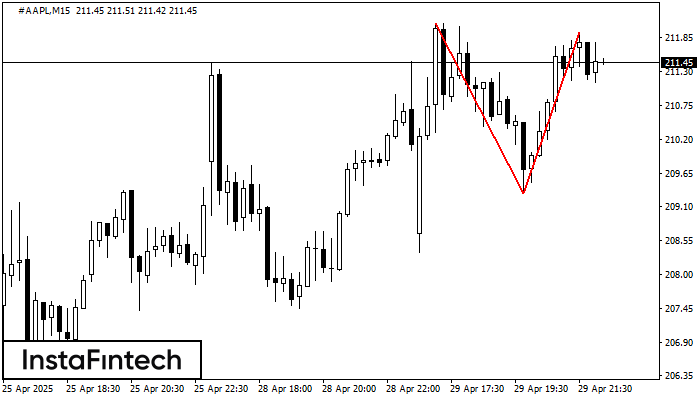
По торговому инструменту #AAPL на M15 сформировалась фигура «Двойная вершина», которая сигнализирует нам об изменении тенденции с восходящей на нисходящую. Вероятно, что, в случае пробоя основания фигуры 209.32, возможно дальнейшее нисходящее движение.
Таймфреймы М5 и М15 могут иметь больше ложных точек входа.
- Все
- Все
- Bearish Rectangle
- Bearish Symmetrical Triangle
- Bearish Symmetrical Triangle
- Bullish Rectangle
- Double Top
- Double Top
- Triple Bottom
- Triple Bottom
- Triple Top
- Triple Top
- Все
- Все
- Покупка
- Продажа
- Все
- 1
- 2
- 3
- 4
- 5
Double Bottom
was formed on 28.05 at 17:05:33 (UTC+0)
signal strength 1 of 5
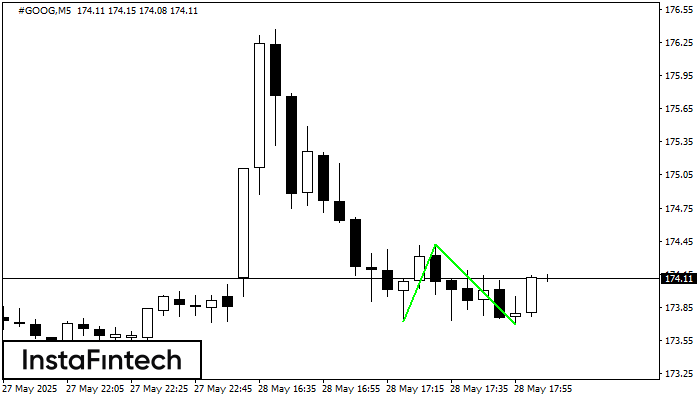
Corak Double Bottom telah dibentuk pada #GOOG M5. Pembentukan ini menandakan pembalikan aliran dari aliran menurun ke atas. Isyarat ialah perdagangan membeli harus dibuka selepas sempadan atas corak 174.42 telah
Carta masa M5 dan M15 mungkin mempunyai lebih banyak titik kemasukan palsu.
Open chart in a new window
Head dan Shoulders
was formed on 28.05 at 17:00:24 (UTC+0)
signal strength 1 of 5
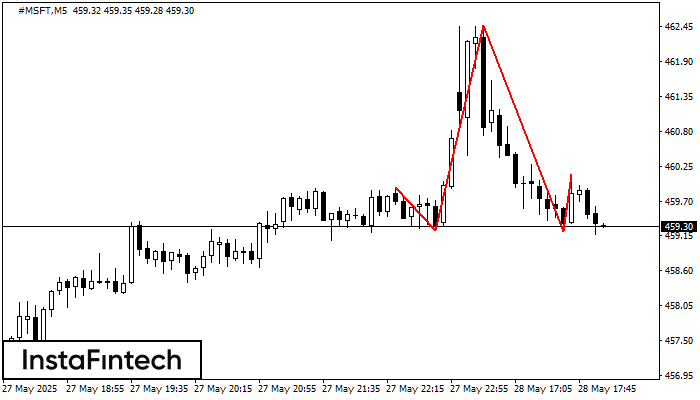
#MSFT M5 membentuk corak Head dan Shoulders dengan ciri-ciri berikut: Bahagian atas Head adalah 462.46, garisan Neck dan sudut menaik berada pada 459.23/459.22. Pembentukan corak ini boleh membawa perubahan dalam
Carta masa M5 dan M15 mungkin mempunyai lebih banyak titik kemasukan palsu.
Open chart in a new window
Triple Top
was formed on 28.05 at 16:45:20 (UTC+0)
signal strength 1 of 5
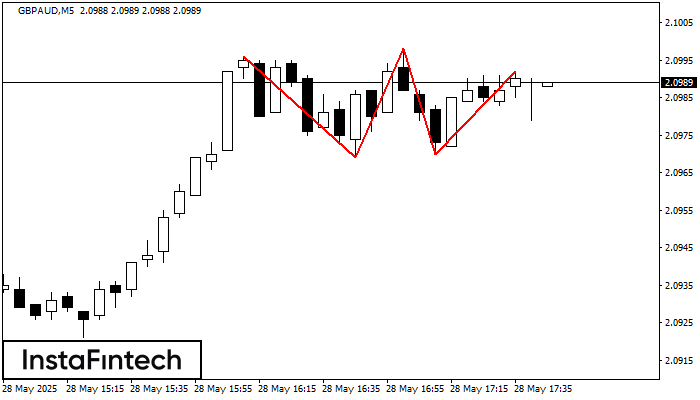
Corak Triple Top telah dibentuk pada carta bagi instrumen dagangan GBPAUD M5. Ia adalah corak pembalikan yang memaparkan ciri-ciri berikut: tahap rintangan 4, tahap sokongan -1, dan lebar corak
Carta masa M5 dan M15 mungkin mempunyai lebih banyak titik kemasukan palsu.
Open chart in a new window


