

Dolzarb patternlar

Двойная вершина
сформирован 29.04 в 13:00:28 (UTC+0)
сила сигнала 2 из 5
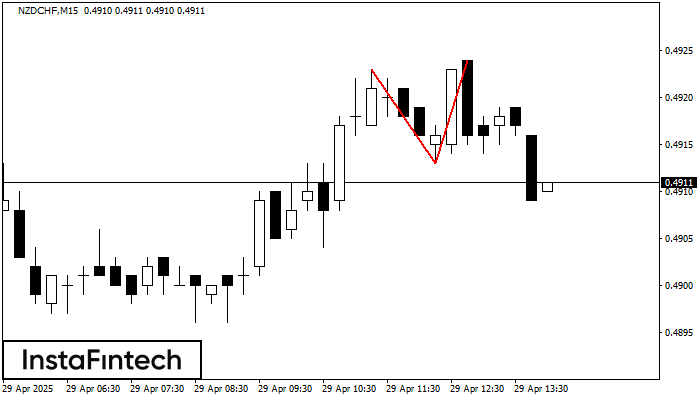
По NZDCHF на M15 сформировалась разворотная фигура «Двойная вершина». Характеристика: Верхняя граница 0.4923; Нижняя граница 0.4913; Ширина фигуры 11 пунктов. Позицию на продажу возможно открыть ниже нижней границы 0.4913, с перспективой хода к уровню 0.4891.
Таймфреймы М5 и М15 могут иметь больше ложных точек входа.
Shuningdek ko'ring
- Все
- Все
- Bearish Rectangle
- Bearish Symmetrical Triangle
- Bearish Symmetrical Triangle
- Bullish Rectangle
- Double Top
- Double Top
- Triple Bottom
- Triple Bottom
- Triple Top
- Triple Top
- Все
- Все
- Покупка
- Продажа
- Все
- 1
- 2
- 3
- 4
- 5
Bullish Rectangle
was formed on 02.06 at 13:16:37 (UTC+0)
signal strength 1 of 5
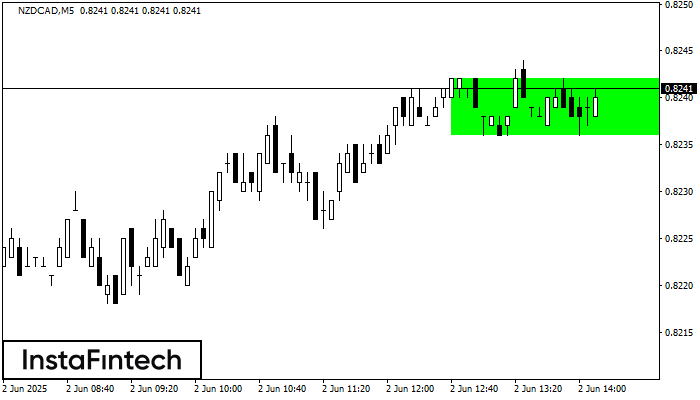
According to the chart of M5, NZDCAD formed the Bullish Rectangle. The pattern indicates a trend continuation. The upper border is 0.8242, the lower border is 0.8236. The signal means
The M5 and M15 time frames may have more false entry points.
Open chart in a new window
Bullish Rectangle
was formed on 02.06 at 13:12:18 (UTC+0)
signal strength 1 of 5
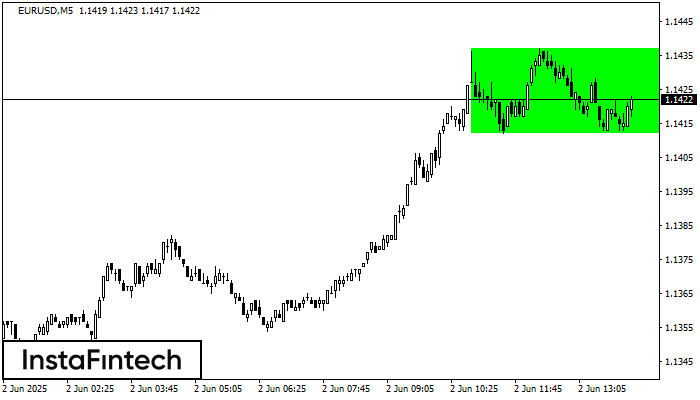
According to the chart of M5, EURUSD formed the Bullish Rectangle. This type of a pattern indicates a trend continuation. It consists of two levels: resistance 1.1437 and support 1.1412
The M5 and M15 time frames may have more false entry points.
Open chart in a new window
Double Top
was formed on 02.06 at 13:05:05 (UTC+0)
signal strength 1 of 5
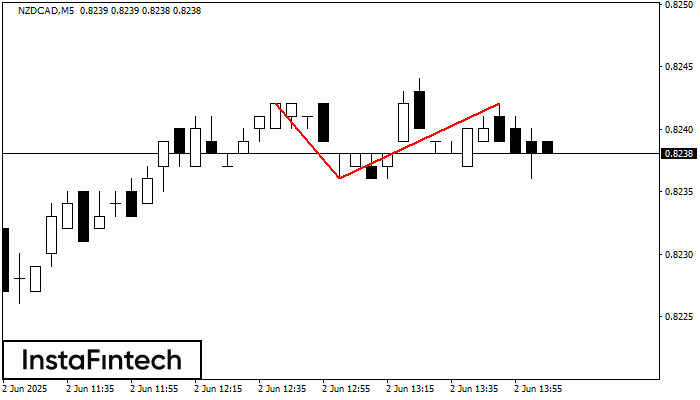
The Double Top reversal pattern has been formed on NZDCAD M5. Characteristics: the upper boundary 0.8242; the lower boundary 0.8236; the width of the pattern is 6 points. Sell trades
The M5 and M15 time frames may have more false entry points.
Open chart in a new window


