

Dolzarb patternlar

Двойное дно
сформирован 29.04 в 12:30:05 (UTC+0)
сила сигнала 3 из 5
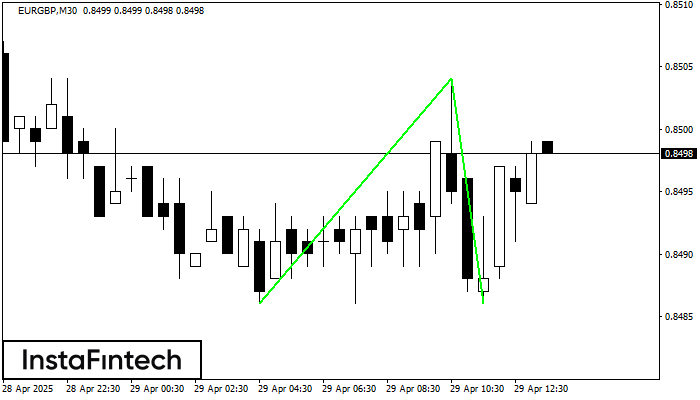
Сформирована фигура «Двойное дно» на графике EURGBP M30. Верхняя граница 0.8504; Нижняя граница 0.8486; Ширина фигуры 18 пунктов. В случае пробоя верхней границы 0.8504 можно будет прогнозировать изменение тенденции, где ширина фигуры и будет являться расстоянием предположительного Тейк Профита.
Shuningdek ko'ring
- Все
- Все
- Bearish Rectangle
- Bearish Symmetrical Triangle
- Bearish Symmetrical Triangle
- Bullish Rectangle
- Double Top
- Double Top
- Triple Bottom
- Triple Bottom
- Triple Top
- Triple Top
- Все
- Все
- Покупка
- Продажа
- Все
- 1
- 2
- 3
- 4
- 5
Triple Top
сформирован 30.05 в 22:20:23 (UTC+0)
сила сигнала 1 из 5

The Triple Top pattern has formed on the chart of the GOLD M5 trading instrument. It is a reversal pattern featuring the following characteristics: resistance level 4, support level -193
The M5 and M15 time frames may have more false entry points.
Открыть график инструмента в новом окне
Inverse Head and Shoulder
сформирован 30.05 в 21:50:24 (UTC+0)
сила сигнала 1 из 5

According to the chart of M5, #AMZN produced the pattern termed the Inverse Head and Shoulder. The Head is fixed at 201.64 while the median line of the Neck
The M5 and M15 time frames may have more false entry points.
Открыть график инструмента в новом окне
Bearish Rectangle
сформирован 30.05 в 21:36:36 (UTC+0)
сила сигнала 1 из 5

According to the chart of M5, GBPAUD formed the Bearish Rectangle which is a pattern of a trend continuation. The pattern is contained within the following borders: lower border 2.0897
The M5 and M15 time frames may have more false entry points.
Открыть график инструмента в новом окне


