

Dolzarb patternlar

Двойная вершина
сформирован 28.04 в 18:25:27 (UTC+0)
сила сигнала 1 из 5
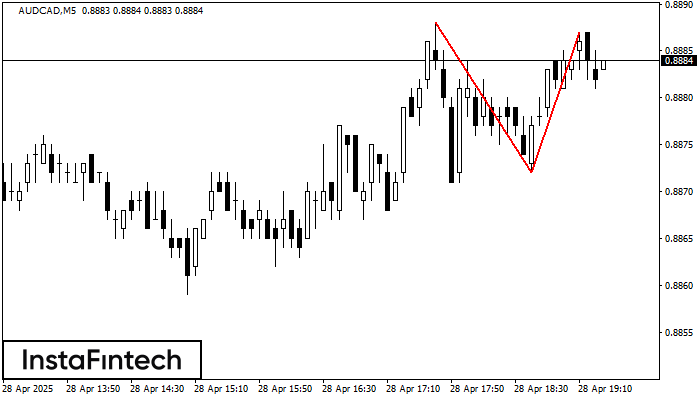
По торговому инструменту AUDCAD на M5 сформировалась фигура «Двойная вершина», которая сигнализирует нам об изменении тенденции с восходящей на нисходящую. Вероятно, что, в случае пробоя основания фигуры 0.8872, возможно дальнейшее нисходящее движение.
Таймфреймы М5 и М15 могут иметь больше ложных точек входа.
Shuningdek ko'ring
- Все
- Все
- Bearish Rectangle
- Bearish Symmetrical Triangle
- Bearish Symmetrical Triangle
- Bullish Rectangle
- Double Top
- Double Top
- Triple Bottom
- Triple Bottom
- Triple Top
- Triple Top
- Все
- Все
- Покупка
- Продажа
- Все
- 1
- 2
- 3
- 4
- 5
Triple Bottom
was formed on 18.09 at 22:46:03 (UTC+0)
signal strength 2 of 5
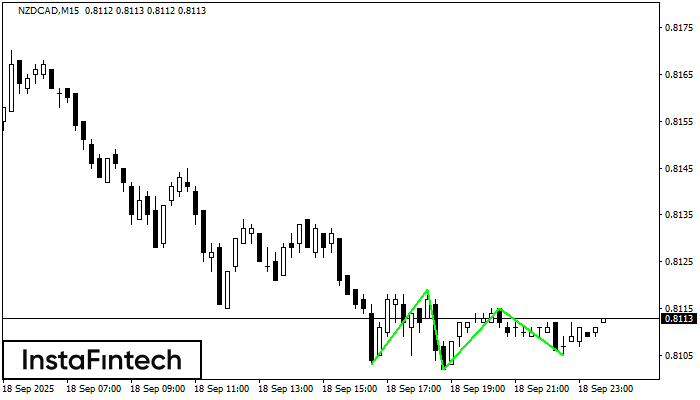
The Triple Bottom pattern has been formed on NZDCAD M15. It has the following characteristics: resistance level 0.8119/0.8115; support level 0.8103/0.8105; the width is 16 points. In the event
The M5 and M15 time frames may have more false entry points.
Open chart in a new window
Bearish Symmetrical Triangle
was formed on 18.09 at 21:00:24 (UTC+0)
signal strength 2 of 5
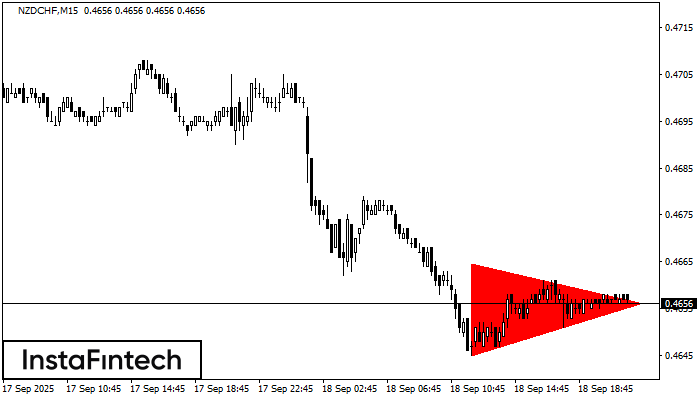
According to the chart of M15, NZDCHF formed the Bearish Symmetrical Triangle pattern. Trading recommendations: A breach of the lower border 0.4645 is likely to encourage a continuation
The M5 and M15 time frames may have more false entry points.
Open chart in a new window
Bearish Symmetrical Triangle
was formed on 18.09 at 20:25:00 (UTC+0)
signal strength 2 of 5
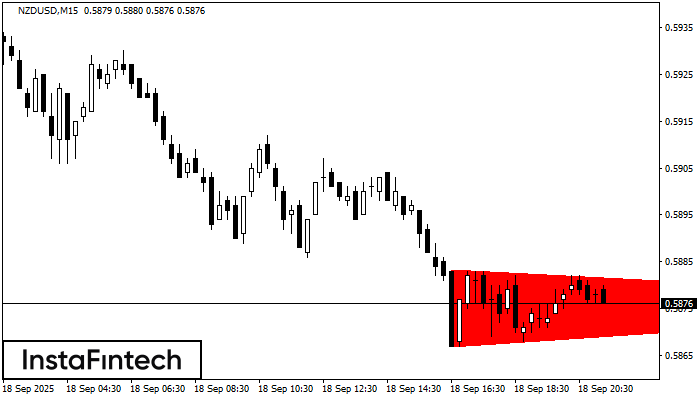
According to the chart of M15, NZDUSD formed the Bearish Symmetrical Triangle pattern. This pattern signals a further downward trend in case the lower border 0.5867 is breached. Here
The M5 and M15 time frames may have more false entry points.
Open chart in a new window


