

Dolzarb patternlar

Тройная вершина
сформирован 26.04 в 20:16:22 (UTC+0)
сила сигнала 1 из 5

На графике #Bitcoin M5 образовалась фигура «Тройная вершина». Данная фигура относится к типу разворотных и имеет характеристику: Верхняя граница 94313.33/94332.71; Нижняя граница 94181.05/94204.35; Ширина фигуры 12797 пунктов. Прогноз: В случае пробоя нижней границы 94181.05 вероятно дальнейшее нисходящее движение к уровню 94332.17.
Таймфреймы М5 и М15 могут иметь больше ложных точек входа.
Shuningdek ko'ring
- Все
- Все
- Bearish Rectangle
- Bearish Symmetrical Triangle
- Bearish Symmetrical Triangle
- Bullish Rectangle
- Double Top
- Double Top
- Triple Bottom
- Triple Bottom
- Triple Top
- Triple Top
- Все
- Все
- Покупка
- Продажа
- Все
- 1
- 2
- 3
- 4
- 5
Bullish pennant
сформирован 13.08 в 22:20:29 (UTC+0)
сила сигнала 1 из 5
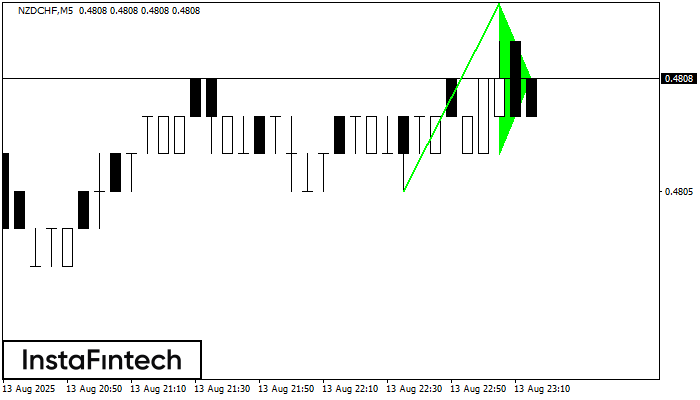
The Bullish pennant pattern is formed on the NZDCHF M5 chart. It is a type of the continuation pattern. Supposedly, in case the price is fixed above the pennant’s high
The M5 and M15 time frames may have more false entry points.
Открыть график инструмента в новом окне
Bullish Rectangle
сформирован 13.08 в 21:15:27 (UTC+0)
сила сигнала 2 из 5
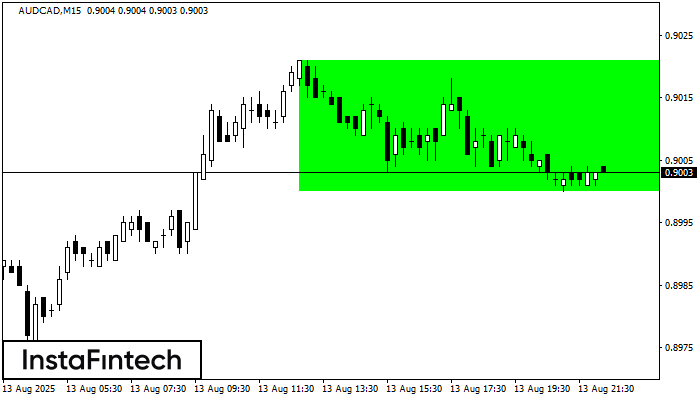
According to the chart of M15, AUDCAD formed the Bullish Rectangle which is a pattern of a trend continuation. The pattern is contained within the following borders: the lower border
The M5 and M15 time frames may have more false entry points.
Открыть график инструмента в новом окне
Triple Bottom
сформирован 13.08 в 20:05:18 (UTC+0)
сила сигнала 1 из 5
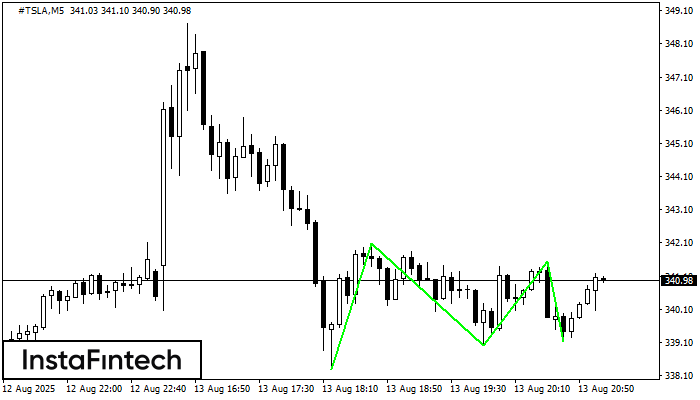
The Triple Bottom pattern has been formed on #TSLA M5. It has the following characteristics: resistance level 342.09/341.55; support level 338.30/339.14; the width is 379 points. In the event
The M5 and M15 time frames may have more false entry points.
Открыть график инструмента в новом окне


