

Dolzarb patternlar

Двойная вершина
сформирован 15.04 в 08:30:13 (UTC+0)
сила сигнала 3 из 5
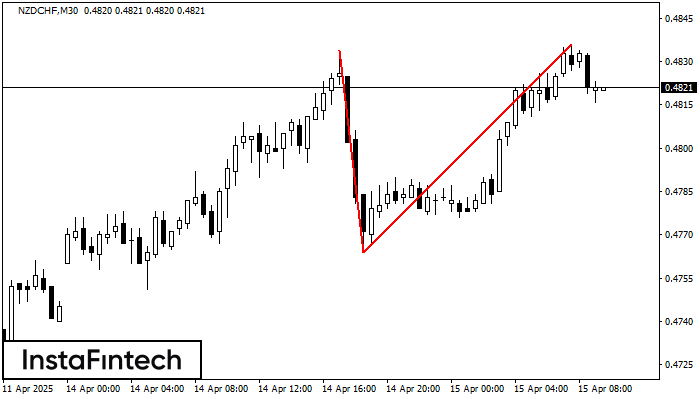
На торговом графике NZDCHF M30 сформировалась разворотная фигура «Двойная вершина». Характеристика: Верхняя граница 0.4836; Нижняя граница 0.4764; Ширина фигуры 72 пунктов. Сигнал: Пробой нижней границы 0.4764 приведет к дальнейшему нисходящему движению с перспективой хода к уровню 0.4734.
Shuningdek ko'ring
- Все
- Все
- Bearish Rectangle
- Bearish Symmetrical Triangle
- Bearish Symmetrical Triangle
- Bullish Rectangle
- Double Top
- Double Top
- Triple Bottom
- Triple Bottom
- Triple Top
- Triple Top
- Все
- Все
- Покупка
- Продажа
- Все
- 1
- 2
- 3
- 4
- 5
Double Bottom
сформирован 21.11 в 08:30:26 (UTC+0)
сила сигнала 3 из 5
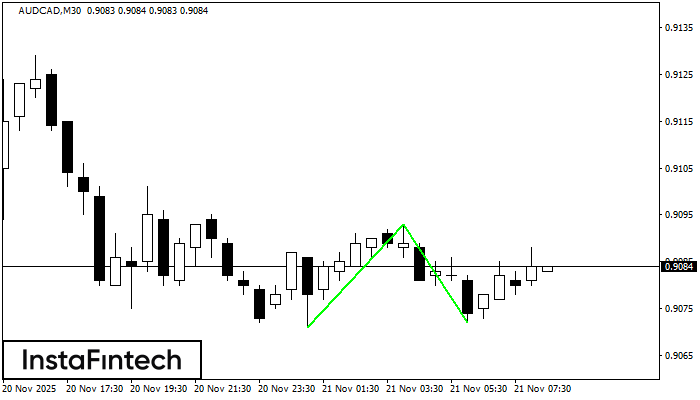
The Double Bottom pattern has been formed on AUDCAD M30. Characteristics: the support level 0.9071; the resistance level 0.9093; the width of the pattern 22 points. If the resistance level
Открыть график инструмента в новом окне
Double Bottom
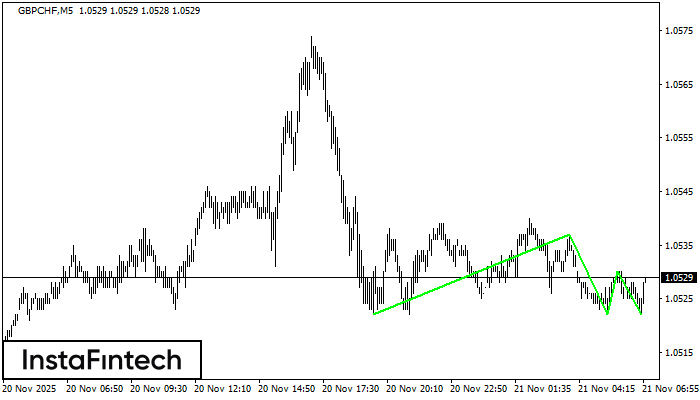
сформирован 21.11 в 07:15:09 (UTC+0)
сила сигнала 2 из 5

The Double Bottom pattern has been formed on GBPCHF M15; the upper boundary is 1.0530; the lower boundary is 1.0522. The width of the pattern is 8 points. In case
The M5 and M15 time frames may have more false entry points.
Открыть график инструмента в новом окне
Triple Bottom
сформирован 21.11 в 07:00:56 (UTC+0)
сила сигнала 1 из 5
The Triple Bottom pattern has formed on the chart of GBPCHF M5. Features of the pattern: The lower line of the pattern has coordinates 1.0537 with the upper limit 1.0537/1.0530
The M5 and M15 time frames may have more false entry points.
Открыть график инструмента в новом окне


