

Dolzarb patternlar

Двойная вершина
сформирован 10.04 в 15:00:21 (UTC+0)
сила сигнала 2 из 5
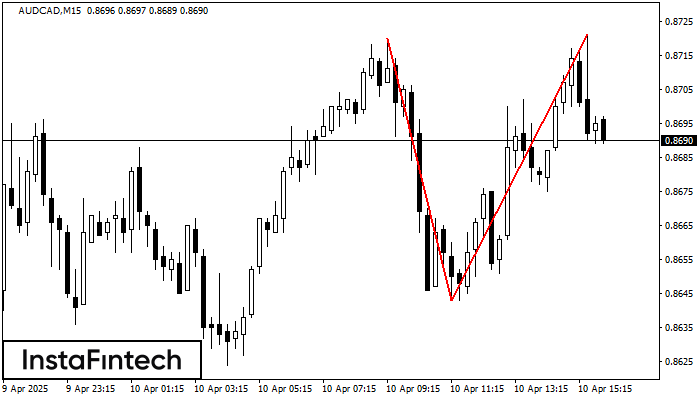
На торговом графике AUDCAD M15 сформировалась разворотная фигура «Двойная вершина». Характеристика: Верхняя граница 0.8721; Нижняя граница 0.8643; Ширина фигуры 78 пунктов. Сигнал: Пробой нижней границы 0.8643 приведет к дальнейшему нисходящему движению с перспективой хода к уровню 0.8620.
Таймфреймы М5 и М15 могут иметь больше ложных точек входа.
- Все
- Все
- Bearish Rectangle
- Bearish Symmetrical Triangle
- Bearish Symmetrical Triangle
- Bullish Rectangle
- Double Top
- Double Top
- Triple Bottom
- Triple Bottom
- Triple Top
- Triple Top
- Все
- Все
- Покупка
- Продажа
- Все
- 1
- 2
- 3
- 4
- 5
Bearish Symmetrical Triangle
сформирован 23.05 в 00:42:21 (UTC+0)
сила сигнала 2 из 5
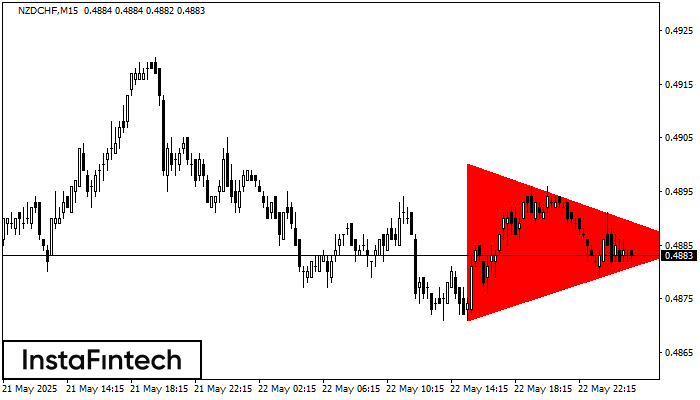
According to the chart of M15, NZDCHF formed the Bearish Symmetrical Triangle pattern. Trading recommendations: A breach of the lower border 0.4871 is likely to encourage a continuation
The M5 and M15 time frames may have more false entry points.
Открыть график инструмента в новом окне
Double Bottom
сформирован 23.05 в 00:40:02 (UTC+0)
сила сигнала 1 из 5
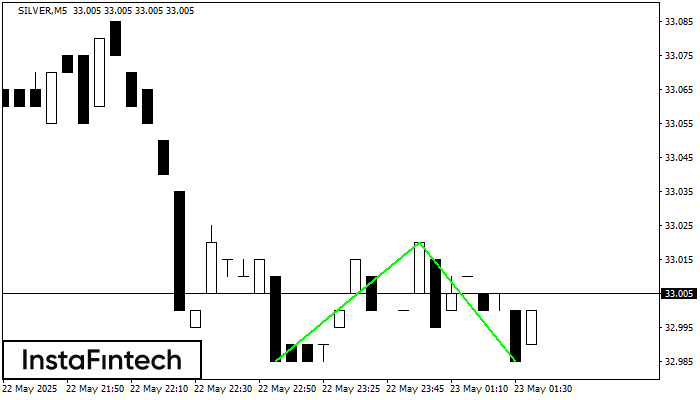
The Double Bottom pattern has been formed on SILVER M5. This formation signals a reversal of the trend from downwards to upwards. The signal is that a buy trade should
The M5 and M15 time frames may have more false entry points.
Открыть график инструмента в новом окне
Bearish Symmetrical Triangle
сформирован 23.05 в 00:27:26 (UTC+0)
сила сигнала 1 из 5
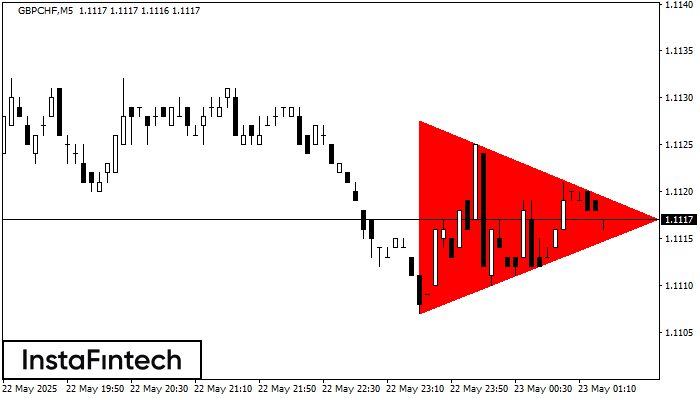
According to the chart of M5, GBPCHF formed the Bearish Symmetrical Triangle pattern. Trading recommendations: A breach of the lower border 1.1107 is likely to encourage a continuation
The M5 and M15 time frames may have more false entry points.
Открыть график инструмента в новом окне


